You can use the schema and API for Indicator documents to customize your dashboards for monitoring apps with App Metrics.
-
To upload an Indicator Document, see cURLing your Indicator Document to App Metrics.
-
To upload an indicator and create a custom chart from the UI, see Adding your Indicator to App Metrics and creating Custom Metric Chart from the UI.
For more information about the schema and API, see Indicator Document API Specification.
This topic also contains an example Indicator Document, named IndicatorDocumentExample.
At this time, only the subset of the name, promql, documentation, and presentation fields shown in the following sections are supported for app indicators.
cURLing your Indicator Document to App Metrics
After you create your Indicator Document, you can push it to App Metrics with the cURL command.
Linux/Mac
curl -vvv <https://metrics.sys.DOMAIN/indicator-documents> -H "Authorization: $(cf oauth-token)" --data-binary "@[YourDoc.yml]"
You can push indicators only for apps that run in a space that you have access to.
- Copy your cf oath token to the clipboard:
cf oauth-token -
Paste your oauth token into the following command:
curl -vvv <https://metrics.sys.DOMAIN/indicator-documents> -H "Authorization: [YOUR-TOKEN]" --data-binary "@[YourDoc.yml]"
After you create your Indicator Document, you can also automate the deployment of app indicator documents in your deployment pipeline.
Indicator Document API specification
The /indicator-documents path supports POST and the /indicator-documents/{org,space,app} path supports the deletion of an indicator Document for a specific org,space,app.
When you delete or upload an Indicator Document, it clears all associated monitors and recorded alerts associated with that app.
You can use demos and examples in the Swagger Editor.
For more details about the Indicator Document API, see the following Open API specification:
openapi: 3.0.2
info:
  title: App Metrics API for Indicator Documents
  version: '1.0'
paths:
  /indicator-documents:
    post:
      description: POST document
      requestBody:
        description: YAML file containing the Indicator Document
        required: true
        content:
          text/yaml;charset=utf-8:
            schema:
              $ref: '#/components/schemas/IndicatorDocument'
            examples:
              errorCountExample:
                $ref: '#/components/examples/IndicatorDocumentExample'
      responses:
        '200':
          description: OK
        '400':
          description: Invalid indicator document format
        '401':
          description: Invalid Authorization header
        '404':
          description: Product name not found
  '/indicator-documents/{productName}':
    parameters:
      - name: productName
        in: path
        required: true
        description: product name associated with the indicator document to delete
        schema:
          type: string
    delete:
      description: DELETE document
      responses:
        '204':
          description: OK
        '401':
          description: Invalid Authorization header
        '404':
          description: Product name not found
components:
  schemas:
    IndicatorDocument:
      type: object
      required:
        - apiVersion
        - kind
        - spec
      properties:
        apiVersion:
          type: string
          enum:
            - indicatorprotocol.io/v1
        kind:
          type: string
          enum:
            - IndicatorDocument
        spec:
          type: object
          required:
            - product
          properties:
            product:
              type: object
              required:
                - name
                - version
              properties:
                name:
                  type: string
                  minLength: 1
                version:
                  type: string
                  minLength: 1
            indicators:
              type: array
              items:
                type: object
                required:
                  - name
                  - promql
                properties:
                  name:
                    type: string
                    pattern: '[a-zA-Z_:][a-zA-Z0-9_:]*'
                  promql:
                    type: string
                    minLength: 1
                  presentation:
                    type: object
                    properties:
                      chartType:
                        type: string
                        enum:
                          - step
                          - quota
                      units:
                        type: string
                        enum:
                          - none
                          - bytes
                          - counts
                          - percentage
                        description: |
                          The units are responsible for automatic formatting of chart data. Bytes are automatically be
                          converted to kB, MB, GB, or TB as appropriate. counts are converted to K or M as appropriate.
                          percentage is formatted as a percentage. none rounds to 2 decimals.
                  documentation:
                    type: object
                    properties:
                      title:
                        type: string
                        description: Title that the chart displays
                      description:
                        type: string
                        description: What is the chart trying to display?
                      recommendedMeasurement:
                        type: string
                        description: 'Explanation of time frame, PromQL query in general'
                      recommendedResponse:
                        type: string
                        description: Troubleshooting information
                      thresholdNote:
                        type: string
                        description: Explanations for why the thresholds exist
  examples:
    IndicatorDocumentExample:
      description: |
        An indicator document specifying one custom indicator called CustomErrorCount500 for the
        application `org,space,app`.

        It shows  the 1 minute average errors as reported by the custom metric `customMetricName500`. The
        `$sourceId` is interpolated to the source_id of the app at rendering time.

        The title of the graph displays as "Custom Metric 500 Errors".
      value: |
        ---
        apiVersion: indicatorprotocol.io/v1
        kind: IndicatorDocument

        spec:
          product:
            name: org,space,app-name
            version: 0.0.1

          indicators:
            - name: CustomErrorCount500
              promql: "sum(rate(customMetricName500{source_id='$sourceId'}[1m]))"
              documentation:
                title: "Custom Metric 500 Errors"
              presentation:
                units: "counts"
Adding your Indicator Document and creating a custom metric chart from the UI
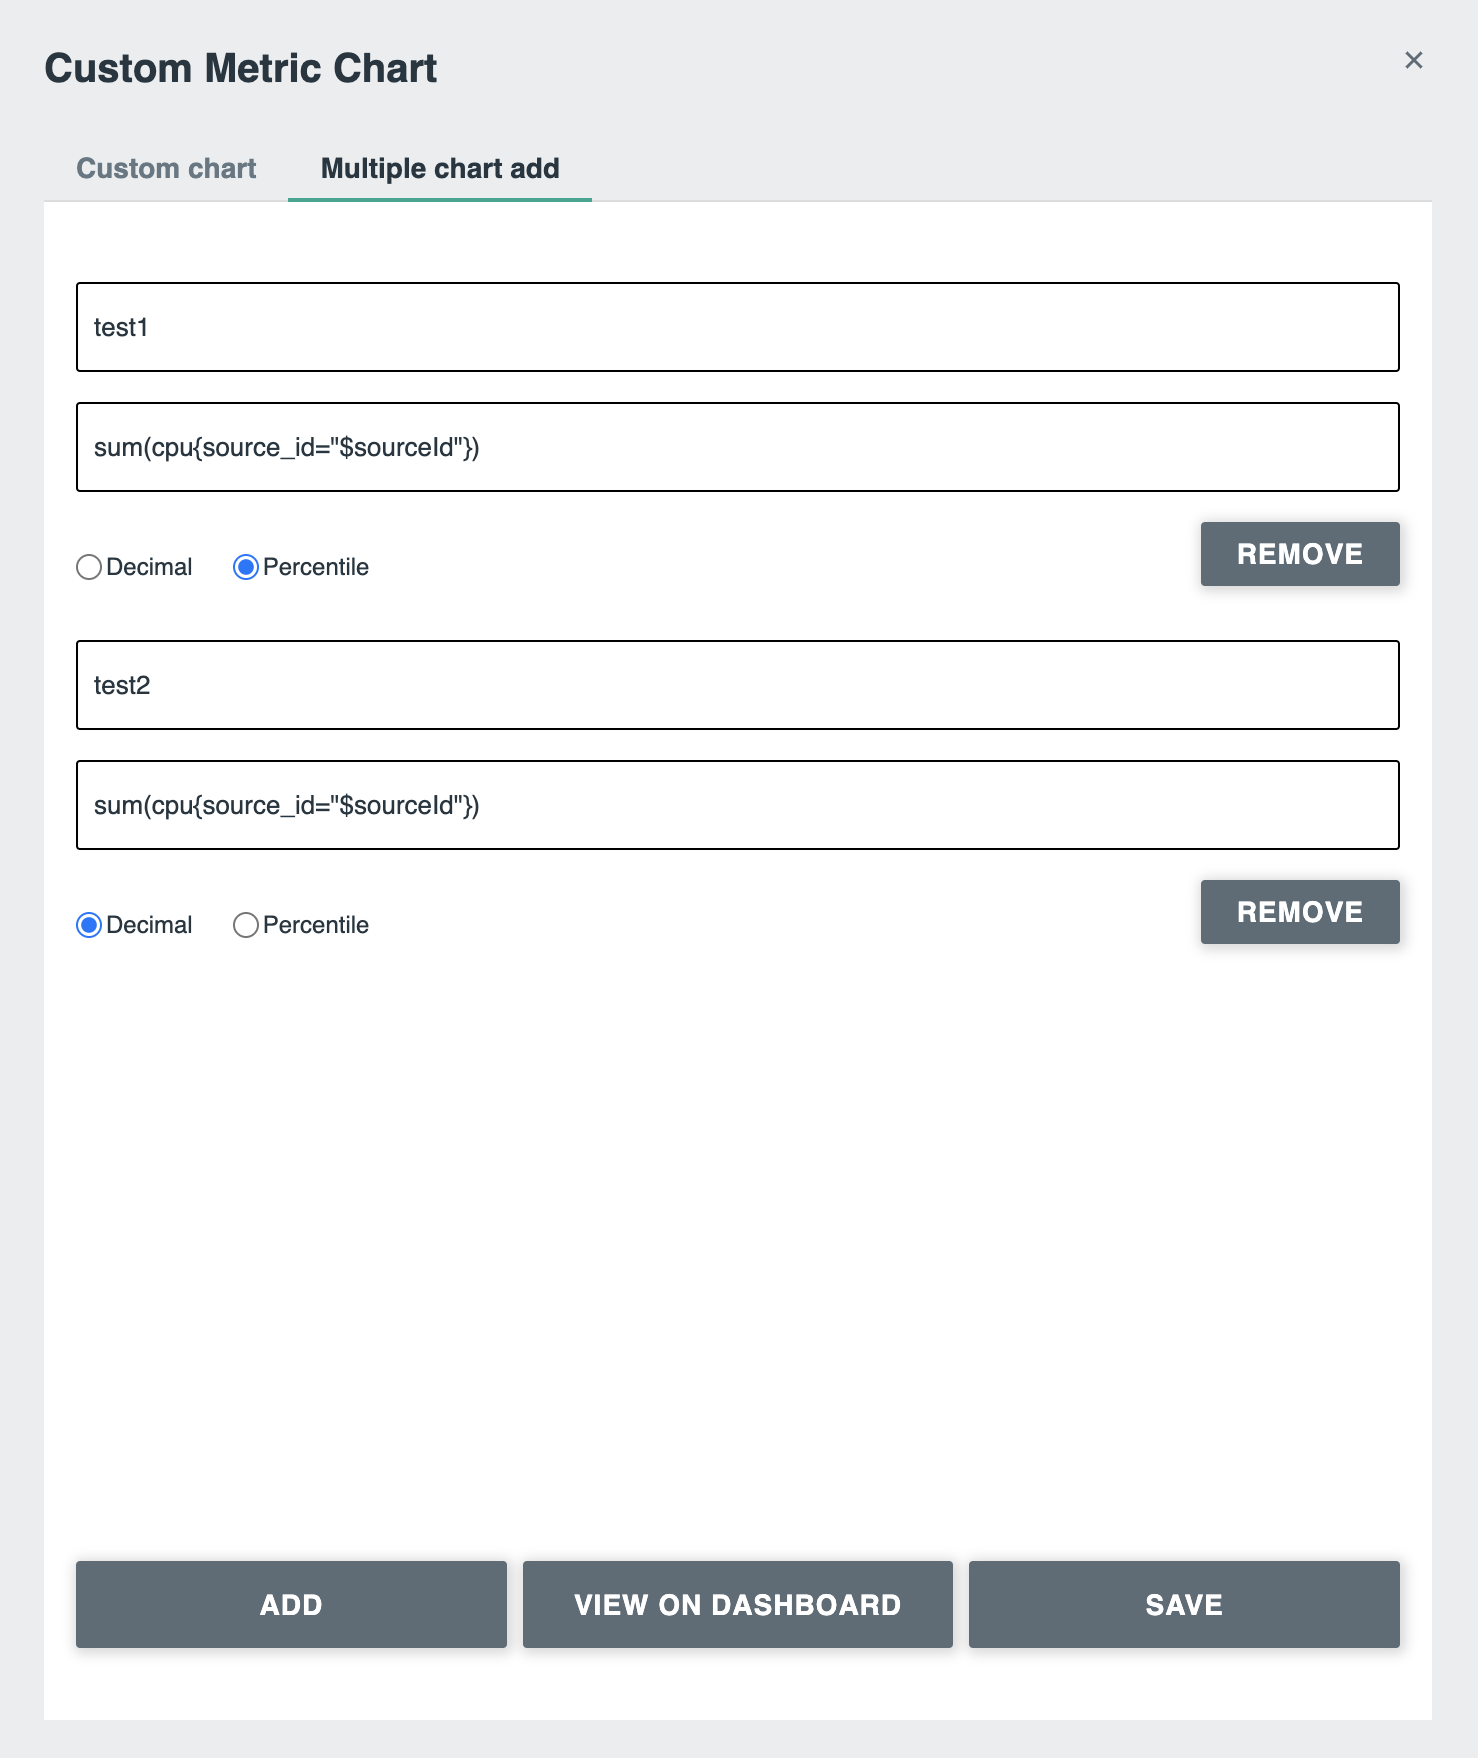
To upload, edit or remove a custom chart for the specific application from the UI, use the following steps:
- Click the plus (+) icon.
-
Fill in all required fields to create a single or multiple custom chart, then click one of the following:
- Click Save to upload and save the newly created custom chart into the Dashboard.
- Click View On Dashboard to temporarily add the newly created custom chart into Dashboard so that you can review it. Then, click the Upload icon. If you forget to click the Upload icon, the chart disappears when you refresh the window.

Editing a custom chart for a specific application
To edit a custom chart for an application:
- Click Edit chart.
- Edit all necessary fields.
- Click Execute Query to review the changes.
- Click Save to save the changes and return to dashboard.
To discard the changes and return to the dashboard, close the window.

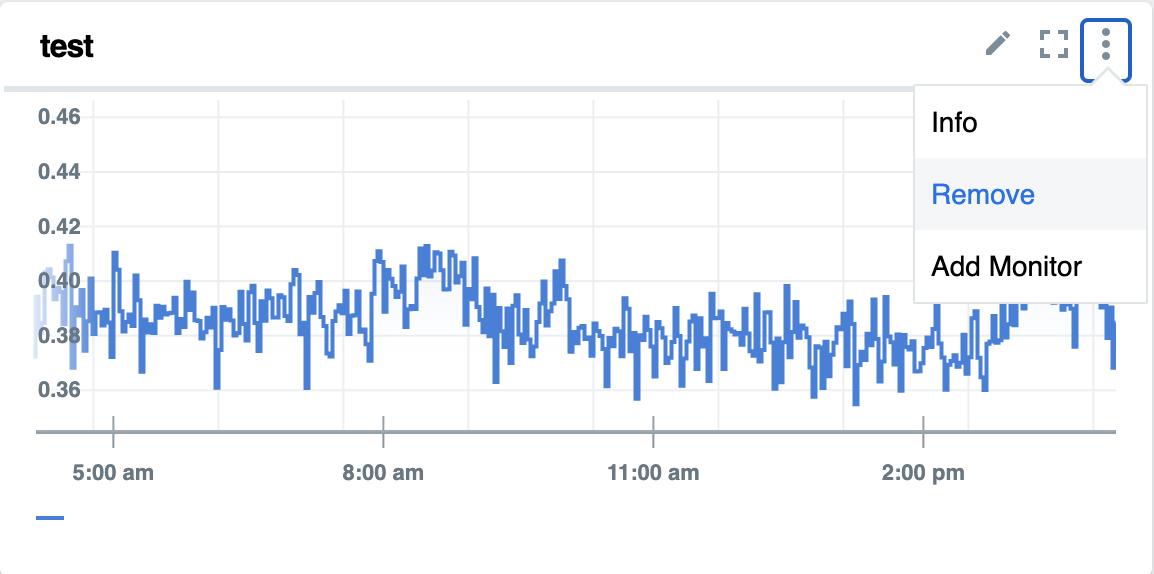
Removing a custom chart for the specific application
To remove a custom chart for an application:
- Click the menu icon on the chart (3 dots in the upper right corner) and click Remove.
- To confirm, click Ok.