You can use detailed information about the schema and API for monitoring documents.
For more information about:
-
Uploading a Monitor Document, see cURLing your Monitor Document to App Metrics.
-
Uploading a Monitor Document from UI, see Adding your Monitor Document to App Metrics from UI.
-
The schema and API, see Monitor Document API specification. This also contains an example Monitor Document, named
MonitorDocumentExample.
Use cURL command to push Monitor Document to App Metrics
After you prepare your Monitor Document, you can push it to App Metrics using the cURL command line. The flow is the same as for the Indicator Document, but it curls to the /monitor-documents endpoint.
Linux/Mac
curl -vvv https://metrics.sys.DOMAIN/monitor-documents -H "Authorization: [cf oauth-token]" --data-binary "@[MONITOR-DOCUMENT.yml]"
Where MONITOR-DOCUMENT is the name of your Monitor Document YAML file.
Windows
-
Copy your OAuth token to the clipboard. Run:
cf oauth-token -
Paste your OAuth token into the following command:
curl -vvv https://metrics.sys.DOMAIN/monitor-documents -H "Authorization: [AUTH-TOKEN]" --data-binary "@[MONITOR-DOCUMENT.yml]"Where:
AUTH-TOKENis the OAuth token you copied in the previous step.MONITOR-DOCUMENTis the name of your Monitor Document YAML file.
You can push monitors only for apps that run in a space that you gain access to.
After you create your Monitor Document, you can automate the deployment of app monitor documents in your deployment pipeline.
Monitor Document API specifications
The /monitors-documents path supports POST. The /monitor-documents/{org,space,app} path supports GET a Monitor Document for a specific org,space,app.
The DELETE variable is not supported for a single Monitor Document. However, a Monitor Document is deleted when you upload a new indicator file for that app. To use demos and examples, see the Swagger Editor sample.
For more details about the Monitor Document API, see the following Open API specification:
openapi: 3.0.2
info:
  title: App Metrics API for Monitor Documents
  version: '1.0'
paths:
  /monitor-documents:
    post:
      description: POST document
      requestBody:
        description: YAML file containing the Monitor Document
        required: true
        content:
          text/yaml;charset=utf-8:
            schema:
              $ref: '#/components/schemas/MonitorDocument'
            examples:
              errorCountExample:
                $ref: '#/components/examples/MonitorDocumentExample'
      responses:
        '200':
          description: OK
        '400':
          description: Invalid monitor document format
        '401':
          description: Invalid Authorization header
        '404':
          description: Product name not found
  '/monitor-documents/{productName}':
    parameters:
      - name: productName
        in: path
        required: true
        description: product name associated with the indicator document to delete
        schema:
          type: string
    get:
      description: GET monitor document
      responses:
        '200':
          description: fetched document successfully
        '400':
          description: No product name supplied
        '401':
          description: Invalid Authorization header
        '404':
          description: Product name not found
components:
  schemas:
    MonitorDocument:
      type: object
      required:
        - product
        - monitors
      properties:
        product:
          type: string
          description: 'org,space,app name for the application to be monitored'
        monitors:
          type: array
          items:
            $ref: '#/components/schemas/Monitor'
        webhook_url:
          type: string
          description: URL of webhook to receive JSON payload when alerts are triggered
    Monitor:
      type: object
      required:
        - name
        - indicator
      properties:
        name:
          type: string
        indicator:
          type: string
          description: |
            Name of the indicator this monitor corresponds to. It could be the name of a custom indicator or one of the
            following default indicators: {RequestCount, HttpLatency, ErrorCount, CPU, MemoryPercentage, DiskPercentage}
        warning:
          description: Threshold at which warning notifications should go off
          $ref: '#/components/schemas/MonitorThreshold'
        critical:
          description: Threshold at which critical notifications should go off
          $ref: '#/components/schemas/MonitorThreshold'
    MonitorThreshold:
      type: object
      required:
        - operator
        - threshold
        - duration
        - only_every
      properties:
        operator:
          type: string
          enum:
            - lt
            - lte
            - ge
            - gte
            - eq
            - neq
        threshold:
          type: number
        duration:
          type: string
          description: How long the value has to be past the threshold before firing an alert.
        only_every:
          type: string
          description: 'Minimum duration between alerts. Alerts trigger only every [this duration].'
  examples:
    MonitorDocumentExample:
      description: |
        A monitor on the ErrorCount indicator for the system,catalyst,appmetrics application that sends alerts to
        https://my-slack-webhook.com.

        A warning alert gets sent when the ErrorCount is greater than 1 for a duration of at least one minute, and
        only gets sent a maximum of once every hour.

        A critical alert gets sent when the ErrorCount is greater than 2 for a duration of at least one minute,
        and only gets sent a maximum of every fifteen minutes.
      value: |
        ---
        product: system,catalyst,appmetrics

        webhook_url: https://my-slack-webhook.com

        monitors:
          - name: 500 Errors For Application
            indicator: ErrorCount
            warning:
               operator: gte
               threshold: 1.0
               duration: 1m
               only_every: 1h
            critical:
               operator: gte
               threshold: 2.0
               duration: 1m
               only_every: 15m
Adding your Monitor Document to App Metrics from the UI
You can add, edit, or delete a Monitor Document for a specific application chart from the UI.
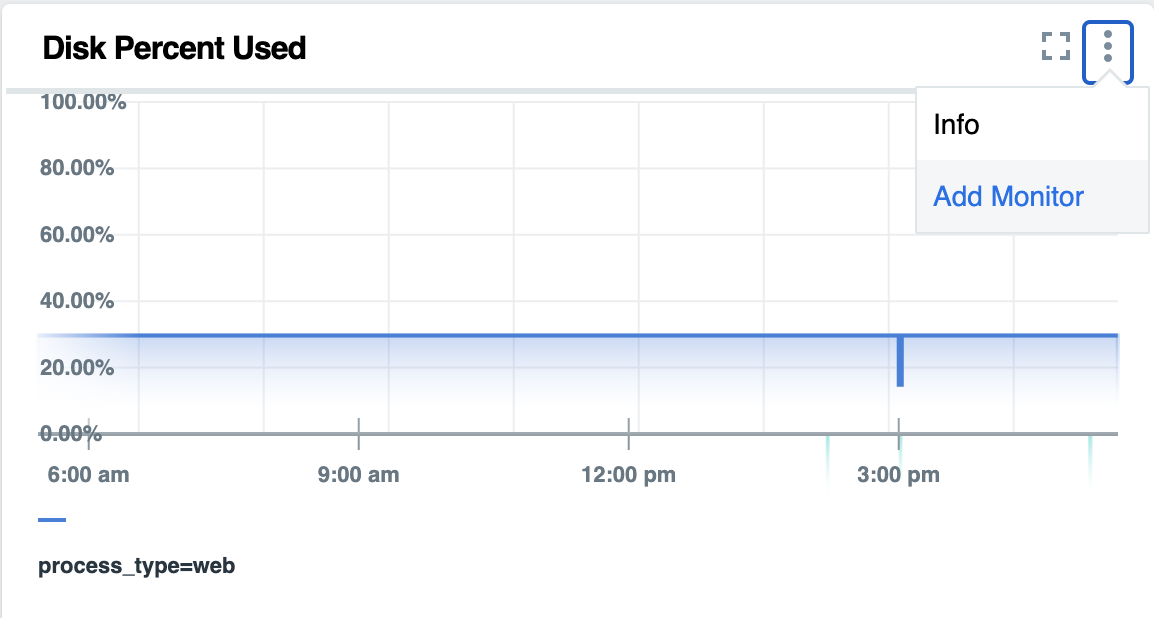
Adding a Monitor to a specific chart
To add a Monitor Document to a specific chart, follow these steps:
- Select the chart for the application, click the menu button (three dots in the top right corner) and select Add Monitor.
-
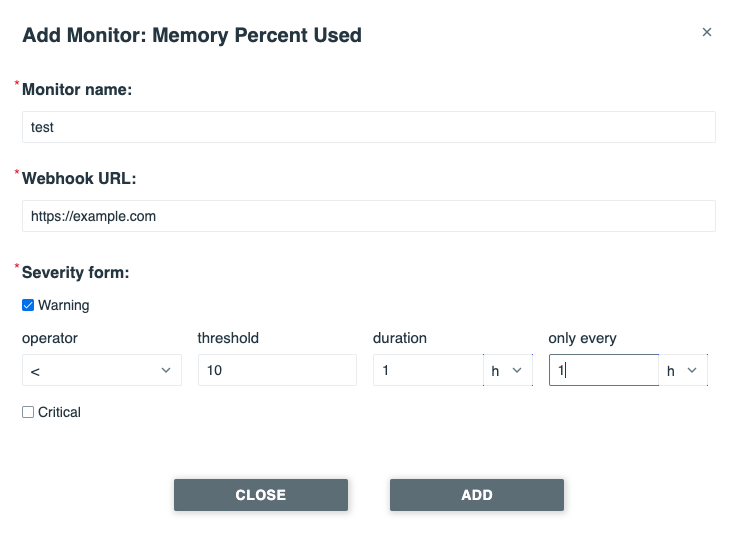
Fill in the required fields:
- Monitor name is the URL of webhook to receive JSON payload when alerts are triggered.
- Webhook Url is the URL of webhook to receive JSON payload when alerts are triggered.
- Severity level Choose at least one severity level, either Warning or Critical.
- Operator: one of the comparison operators. For example, <, <=, >, >=, =, !=.
- Threshold: the value parameter for Operator.
- Duration: how long the value has to be past the threshold before firing an alert.
- Only Every: the minimum duration between alerts. Alerts trigger only every [this duration].
-
Click Add.
Editing or deleting a monitor for a specific chart
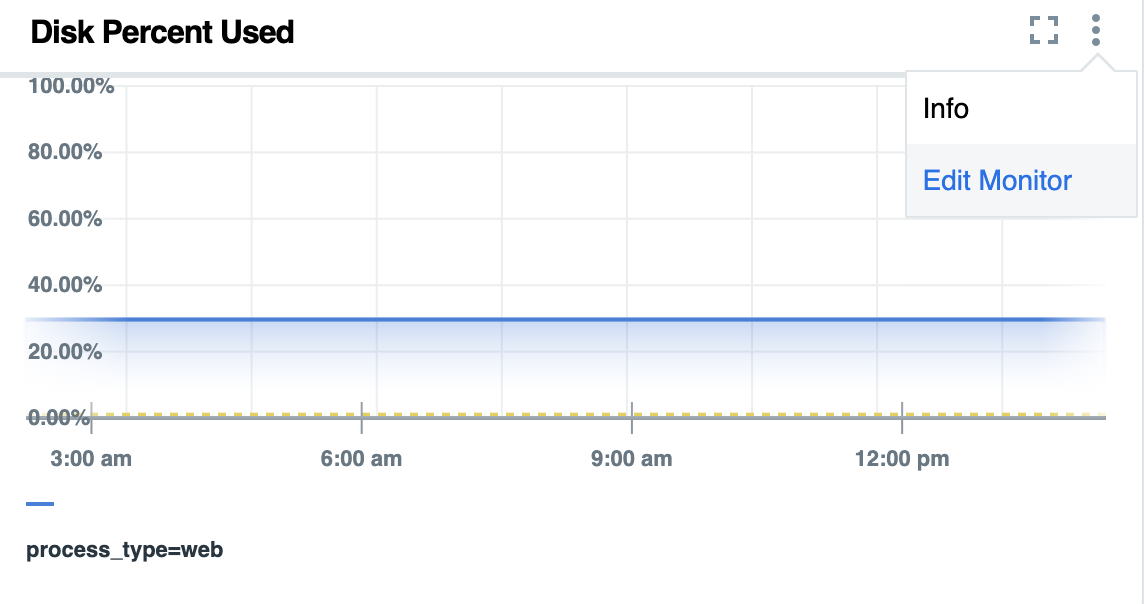
To edit or delete a Monitor, follow these steps:
- Select chart you want to edit and click the menu button (three dots in the top right corner) and click Edit Monitor.
- Edit the fields as necessary.
- Click Edit to change the monitor.
- Click Delete Monitor to delete the monitor.