Overview and Use Case
The Dashboard App deployed by the platform tile creates a set of KPI health rules that implement the Pivotal best practices for platform monitoring and proactively alert you when there’s an issue with a foundation that may impact application performance. These alerts can be associated with actions such as opening a support ticket using AppDynamics Policies.
The Dashboard App also creates a Single Foundation Dashboard and Multi-Foundation Dashboards, which leverage the KPI health rules to track the health of a single or multiple foundations and are appropriate for displaying in an operations center.
KPI Metrics
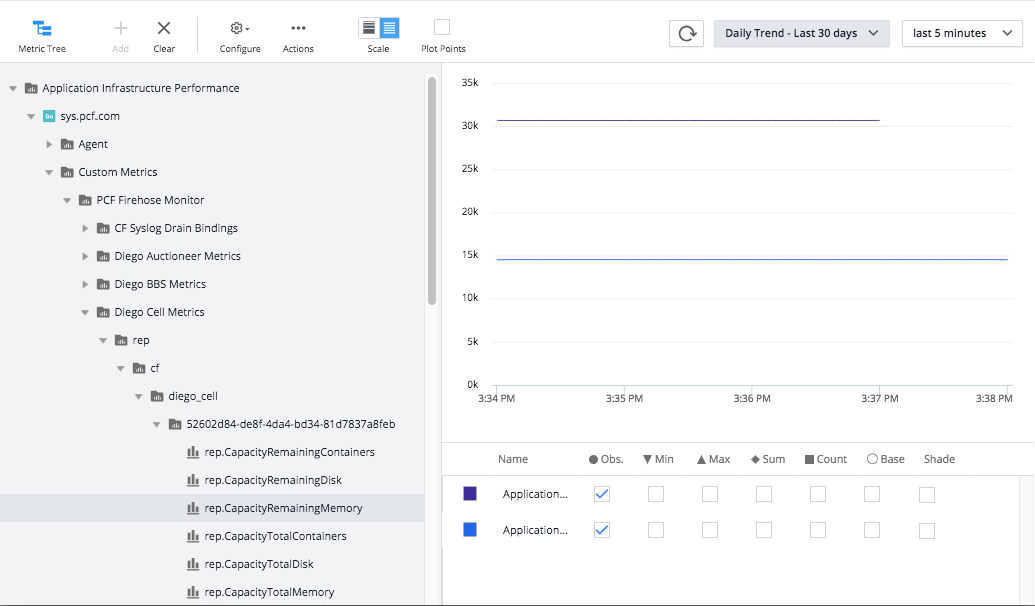
The AppDynamics Nozzle reads metrics from the Loggregator Firehose and publishes them as custom metrics to the controller configured in the tile. You can view the metrics in the Metrics Browser under the app and tier assigned in the tile. The app and tier names are “appd-nozzle- v2” and the name of the VMware Tanzu system domain, respectively, unless they were overridden in the tile.
The metric path is Application Infrastructure Performance|<tier>|Custom Metrics|PCF Firehose Monitor. By default, the metrics from the “rep” origin are displayed. In the example below, “sys.pcf.com” is the tier name, and the subcategories of rep metrics are displayed, including the capacity metrics for Diego Cells. Additional metrics sources, for example origins, can also be configured. For more information, see the AppDynamics Advanced Metrics section of the tile.
KPI Health Rules
The KPI health rules map directly to the Key Performance Indicators and Key Scaling Indicators defined by Pivotal, as listed below. Each indicator includes context information, a threshold, and what to do if the threshold is breached. The KPI health rules are named as they appear in the Pivotal KPI documentation, and prefixed with the tier name.
-
Key Performance Indicators (KPIs) for monitoring Pivotal Cloud Foundry:
-
Key Capacity Scaling Indicators:
- Diego Cell Capacity Scaling Indicators
- Firehose Performance Scaling Indicators
- CF Syslog Drain Performance Scaling Indicators
- Router Performance Scaling Indicators
- UAA Performance Scaling Indicators
Below is an example of a KPI health rule created for the indicator Diego Cell Memory Capacity, named “sys.pcf.com-Diego Cell Memory Capacity”.
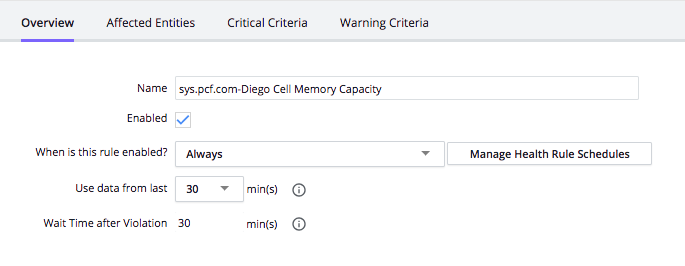
The Critical Criteria is defined based on the threshold from the Diego Cell Memory Capacity indicator, which specifies that if the total memory capacity for all Diego Cells falls below 35% an alert should be generated and an operator should consider scaling the number of Diego Cells.

To attach a KPI health rule to an action, such as sending an email or opening a ticket, see the AppDynamics Policy documentation.
KPI Dashboards
The platform tile supports two types of dashboards. The Single Foundation Dashboard is generated by default and displays the health and performance details for the foundation where the tile is installed. Multi-foundation dashboards summarize the health and performance of multiple foundations in a single dashboard, and are created for each Multi-foundation Dashboard configuration that is added in the platform tile.
Single Foundation Dashboard
The Single Foundation Dashboard visualizes performance of the VMware Tanzu foundation on which the AppDynamics platform tile is installed in a single pane of glass. It is named <app name>-<tier name>-PCF KPI Dashboard based on the app and tier names configured for the Nozzle in the platform tile, which default to appd-nozzle-v2 and <system domain>, respectively. The dashboard uses health status widgets to reflect the current state of the KPI health rules, as well as other widgets to reflect current usage and capacity of the foundation.
The dashboard is separated into three sections:
- (top): Core capacity scaling indicators and measurements for the Diego Cell, Router, and UAA services
- (middle): Key Performance Indicators, active KPI health rule violations and graphs of Router throughput.
- (bottom): System (BOSH) VM health indicators for the core VMware Tanzu services that track the health of each VM supporting a core VMware Tanzu service.
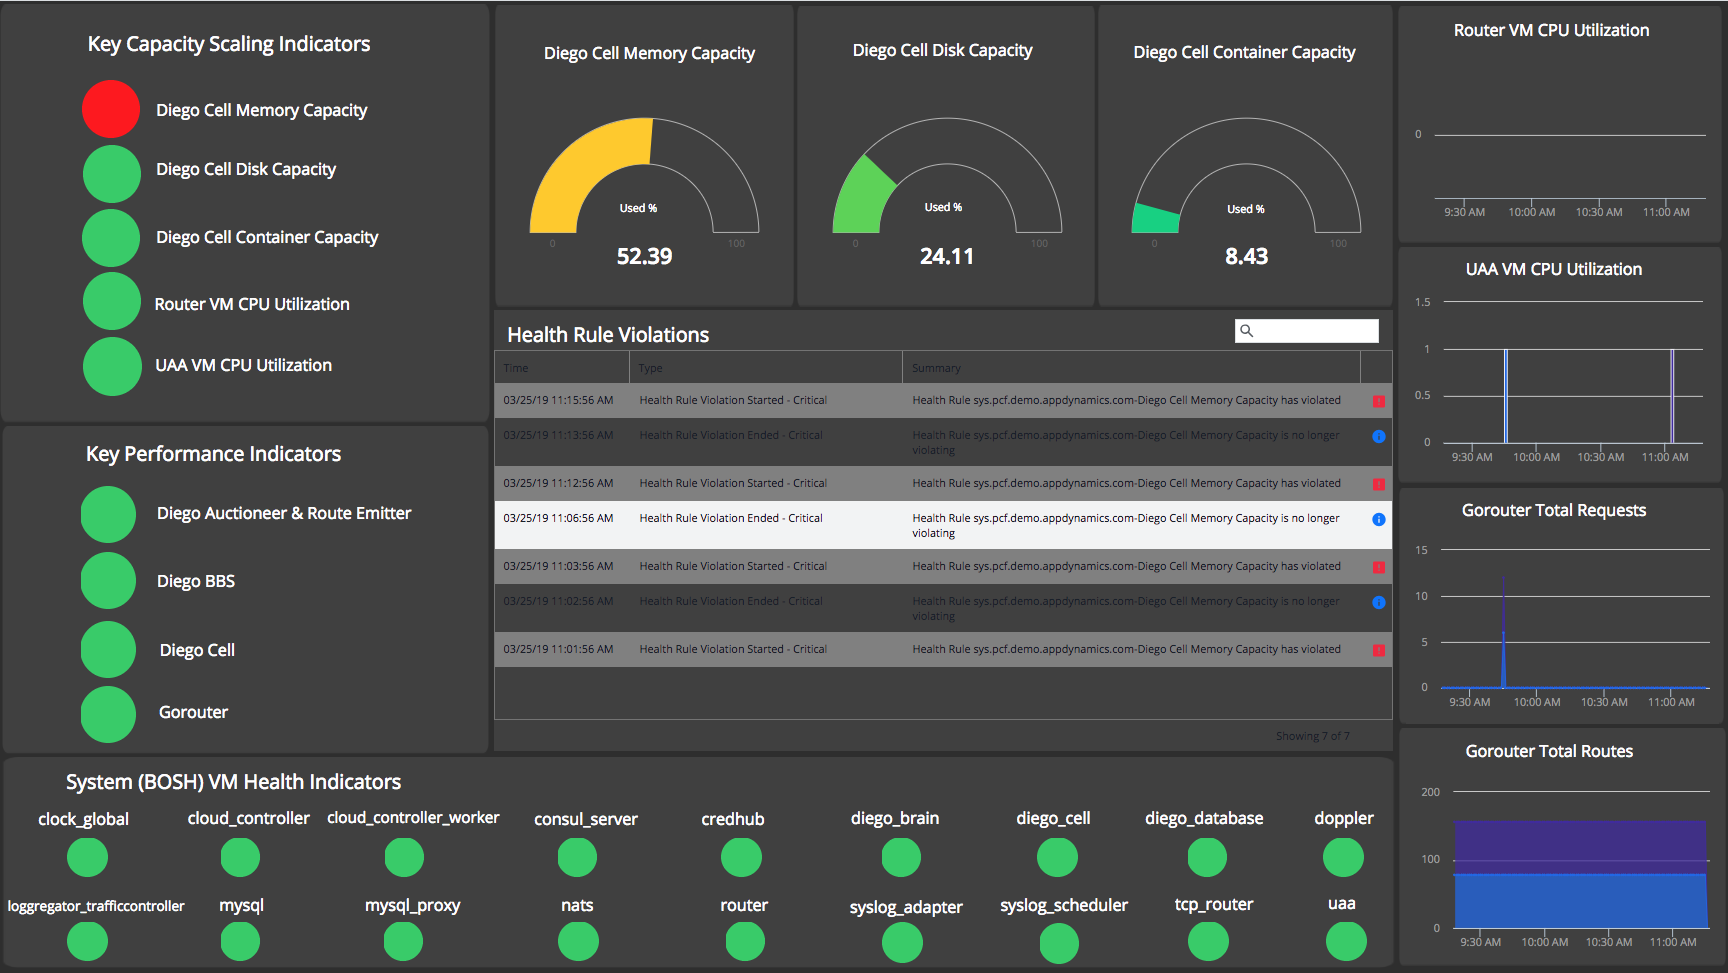
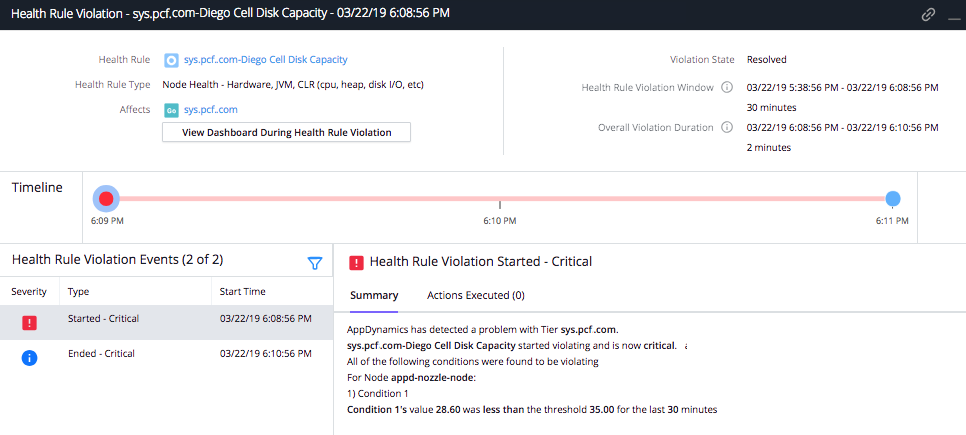
The Health Rule Violation widget includes a search box that can be used to filter the health rules violations. In the example below, a filter is applied to show the Diego Cell Disk Capacity violations, which the dashboard shows as red.

Double-clicking on a row will bring up the details of the violation, the threshold, and the current value of the KPI metric causing the violation.
Multi-Foundation Dashboard
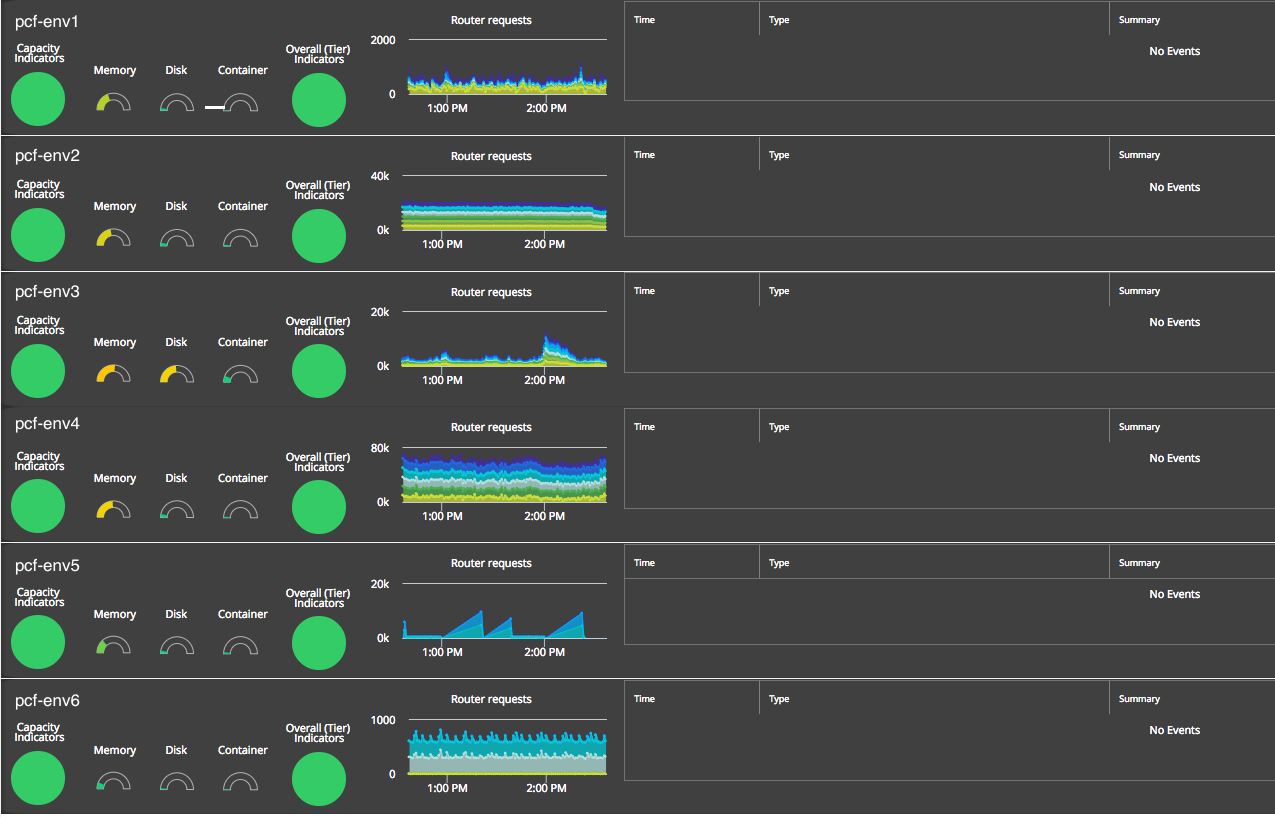
Multi-foundation Dashboards support visualizing the health and performance of multiple foundations on a single dashboard. Below is an example Multi-foundation Dashboard that displays the status of six foundations, one per row. It includes a single “Capacity Indicators” widget to display the aggregate health of the capacity related health rules as well as an “Overall (Tier) Indicators” widget that displays the aggregate status of all the KPI health rules associated with the foundation. Depending on the layout, the dashboard may contain gauge widgets for current capacity, a health rule violation widget, and current router requests.
Recreating KPI HRs or Dashboards
The Dashboard App creates the health rules and dashboards in the controller configured in the platform tile only if they do not exist already. If you want to recreate the health rules and dashboard for a specific foundation, delete them in the controller (or rename them if you want to save any changes made and reapply them). The Dashboard App will recreate the dashboard and health rules within ten minutes (or restart the Dashboard App to recreate them immediately).
Setting up Account to create Dashboards
The “Username for reporting Dashboard” and “Password” fields from the platform tile determine the credentials used by the Dashboard App for creating the KPI health rules and the Single Foundation and Multi-Foundation Dashboards via the REST API. The following screenshots show the minimum permissions required and assume a distinct user is created as well as a role that is assigned to the user.
-
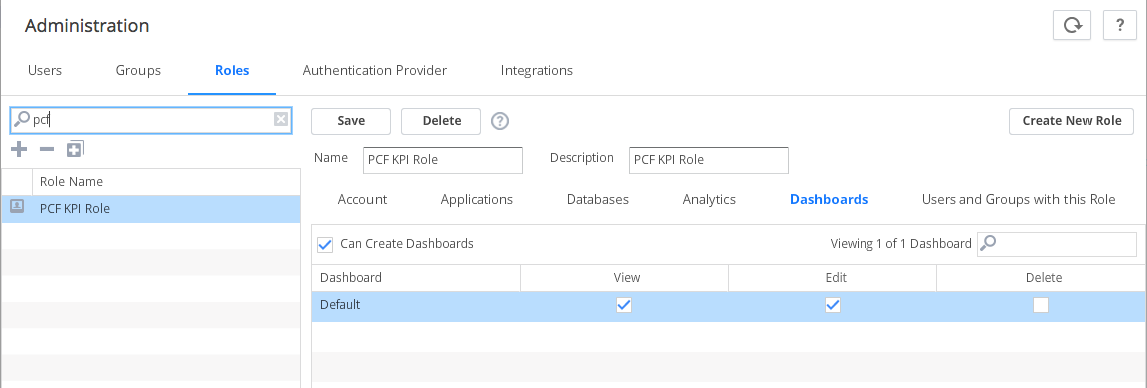
Create a “PCF KPI Role” and under Dashboards assign it “Can Create Dashboards” and View and Edit permission on the Default dashboard.
-
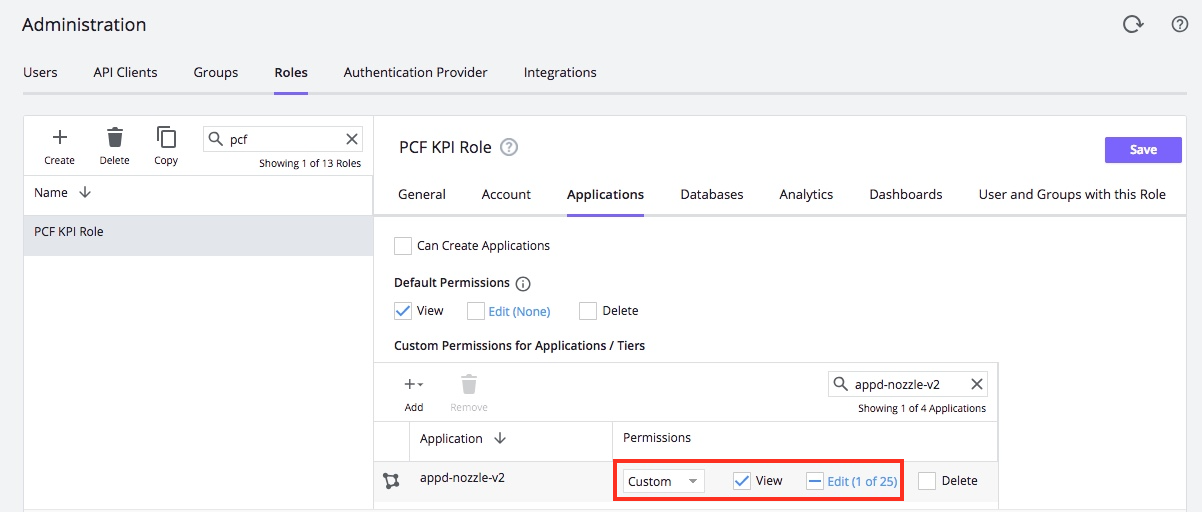
Under Applications, assign the role “Custom” and “View” permissions for the app that the AppDynamics Nozzle reports. The default is appd-nozzle-v2, unless it was overridden under Advanced Configuration of the platform tile.
-
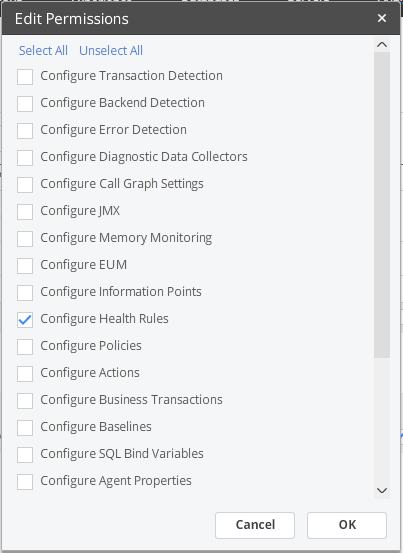
Edit the permissions for the application and select only “Configure Health Rules”.
-
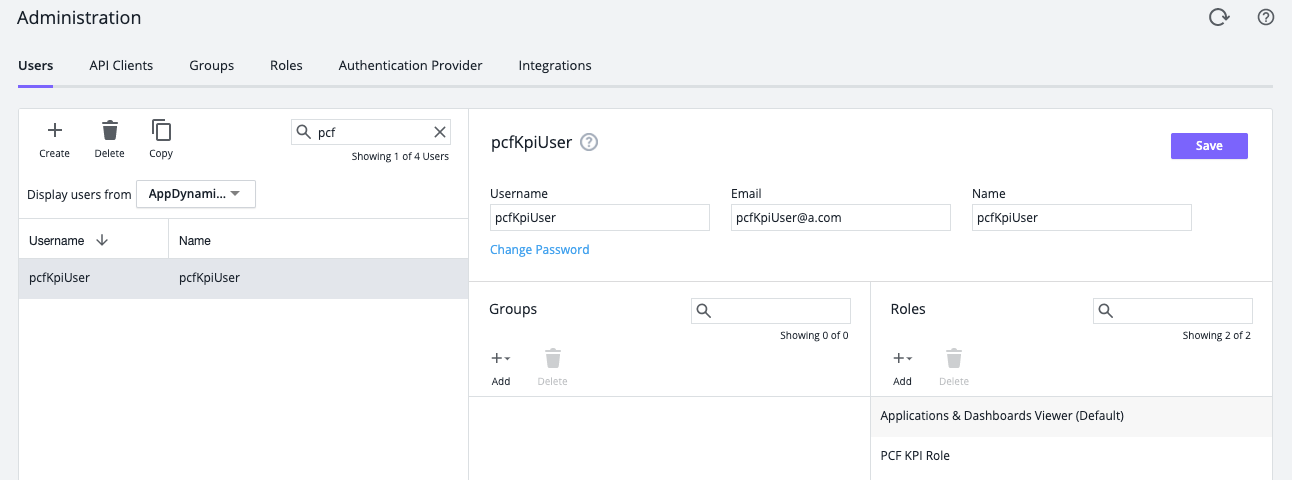
Create a user and assign it the PCF KPI Role as well as the “Applications & Dashboards Viewer (Default)” role. The user and password should match the “Username for reporting Dashboard” and “Password” fields from the platform tile.
