Overview
Dynatrace detects clustered apps and provides visibility into their transaction flows, from the user level to the database and code level. Dynatrace also creates and adapts real-time dependency graphs of all your pushed apps and connected databases. If Dynatrace detects an anomaly in your environment, it directs you to the root cause with these dependency graphs and the data it collects.
The following list describes the key features of Dynatrace:
- AI Powered: Dynatrace Artificial Intelligence locates performance issues and pinpoints underlying root causes in real time.
- Analytical: Dynatrace gives you operational insight and the ability to oversee and manage web-scale applications.
- Self learning: Dynatrace learns your environment and understands the complexity of your distributed applications.
- Provides SaaS convenience with data on-prem: Dynatrace is available as a SaaS offering, but also as a managed solution on your own infrastructure.
See the Dynatrace website for more details about Dynatrace.
Dynatrace Data Views
Dynatrace offers multiple views for application and deployment data, including the following:
-
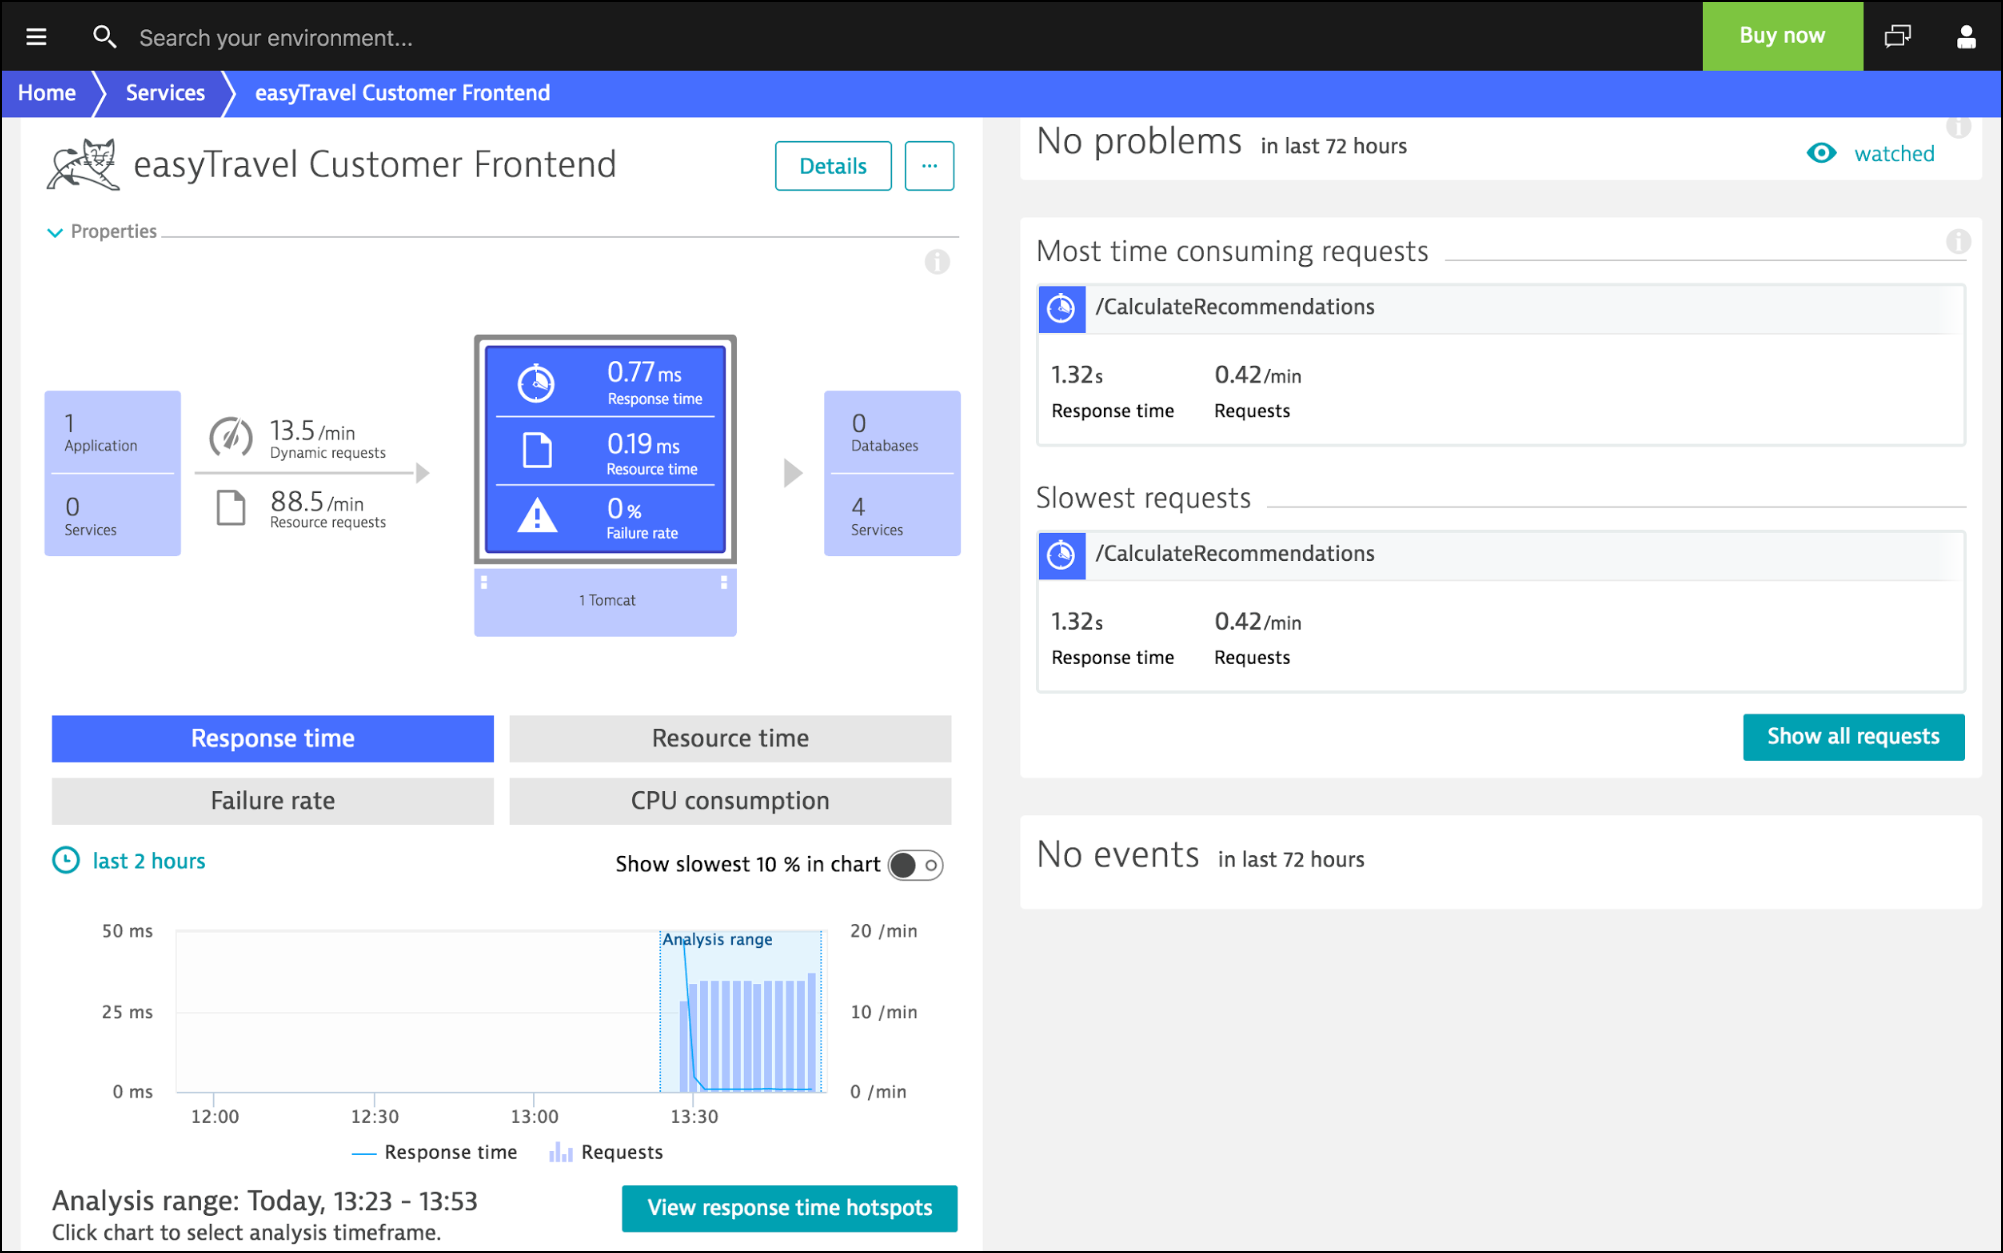
Common metrics for a service, such as response time and failure rate
-
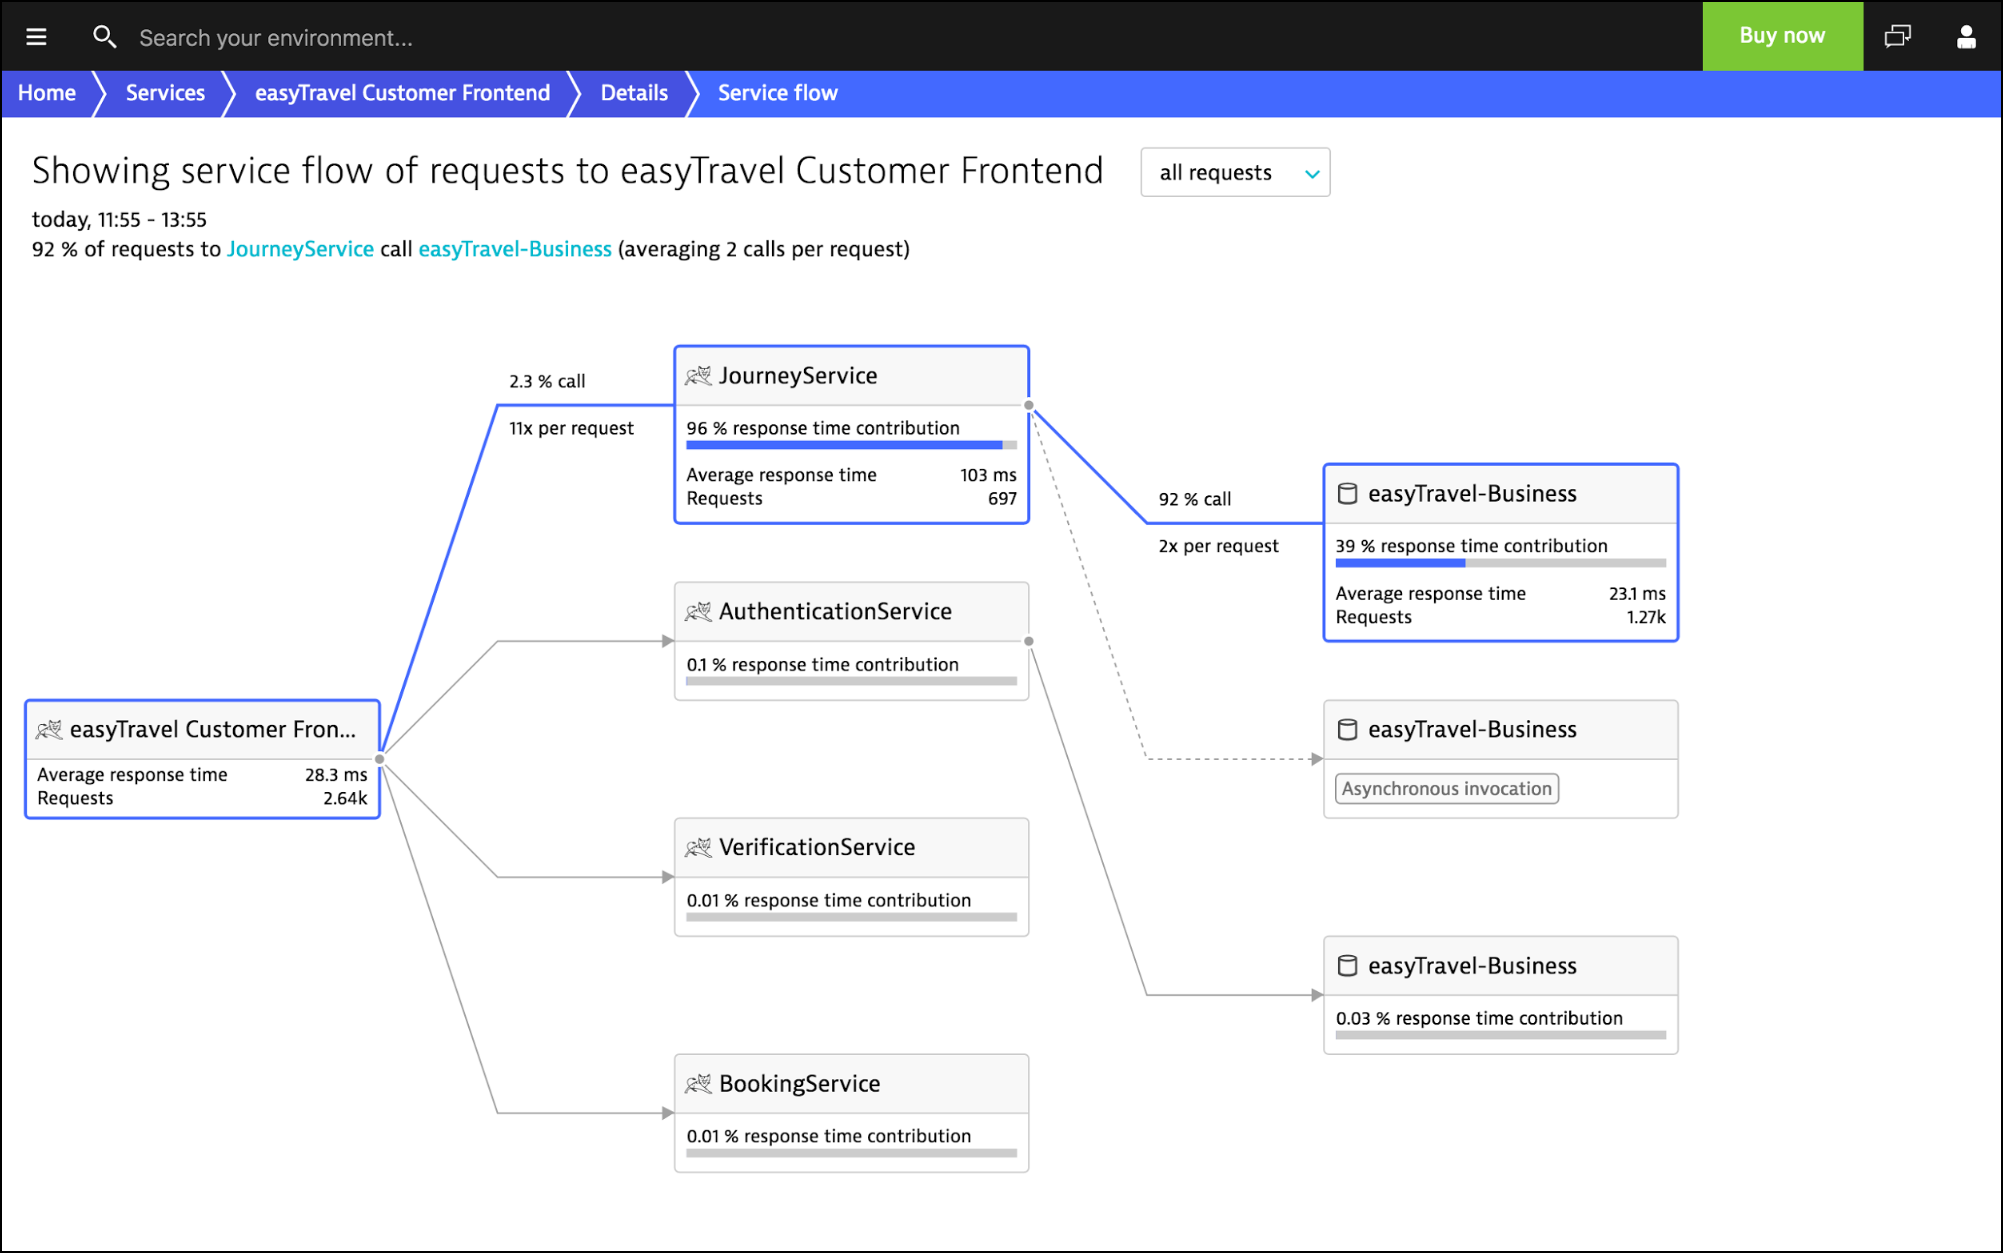
Real time model of a request flow through your services
-
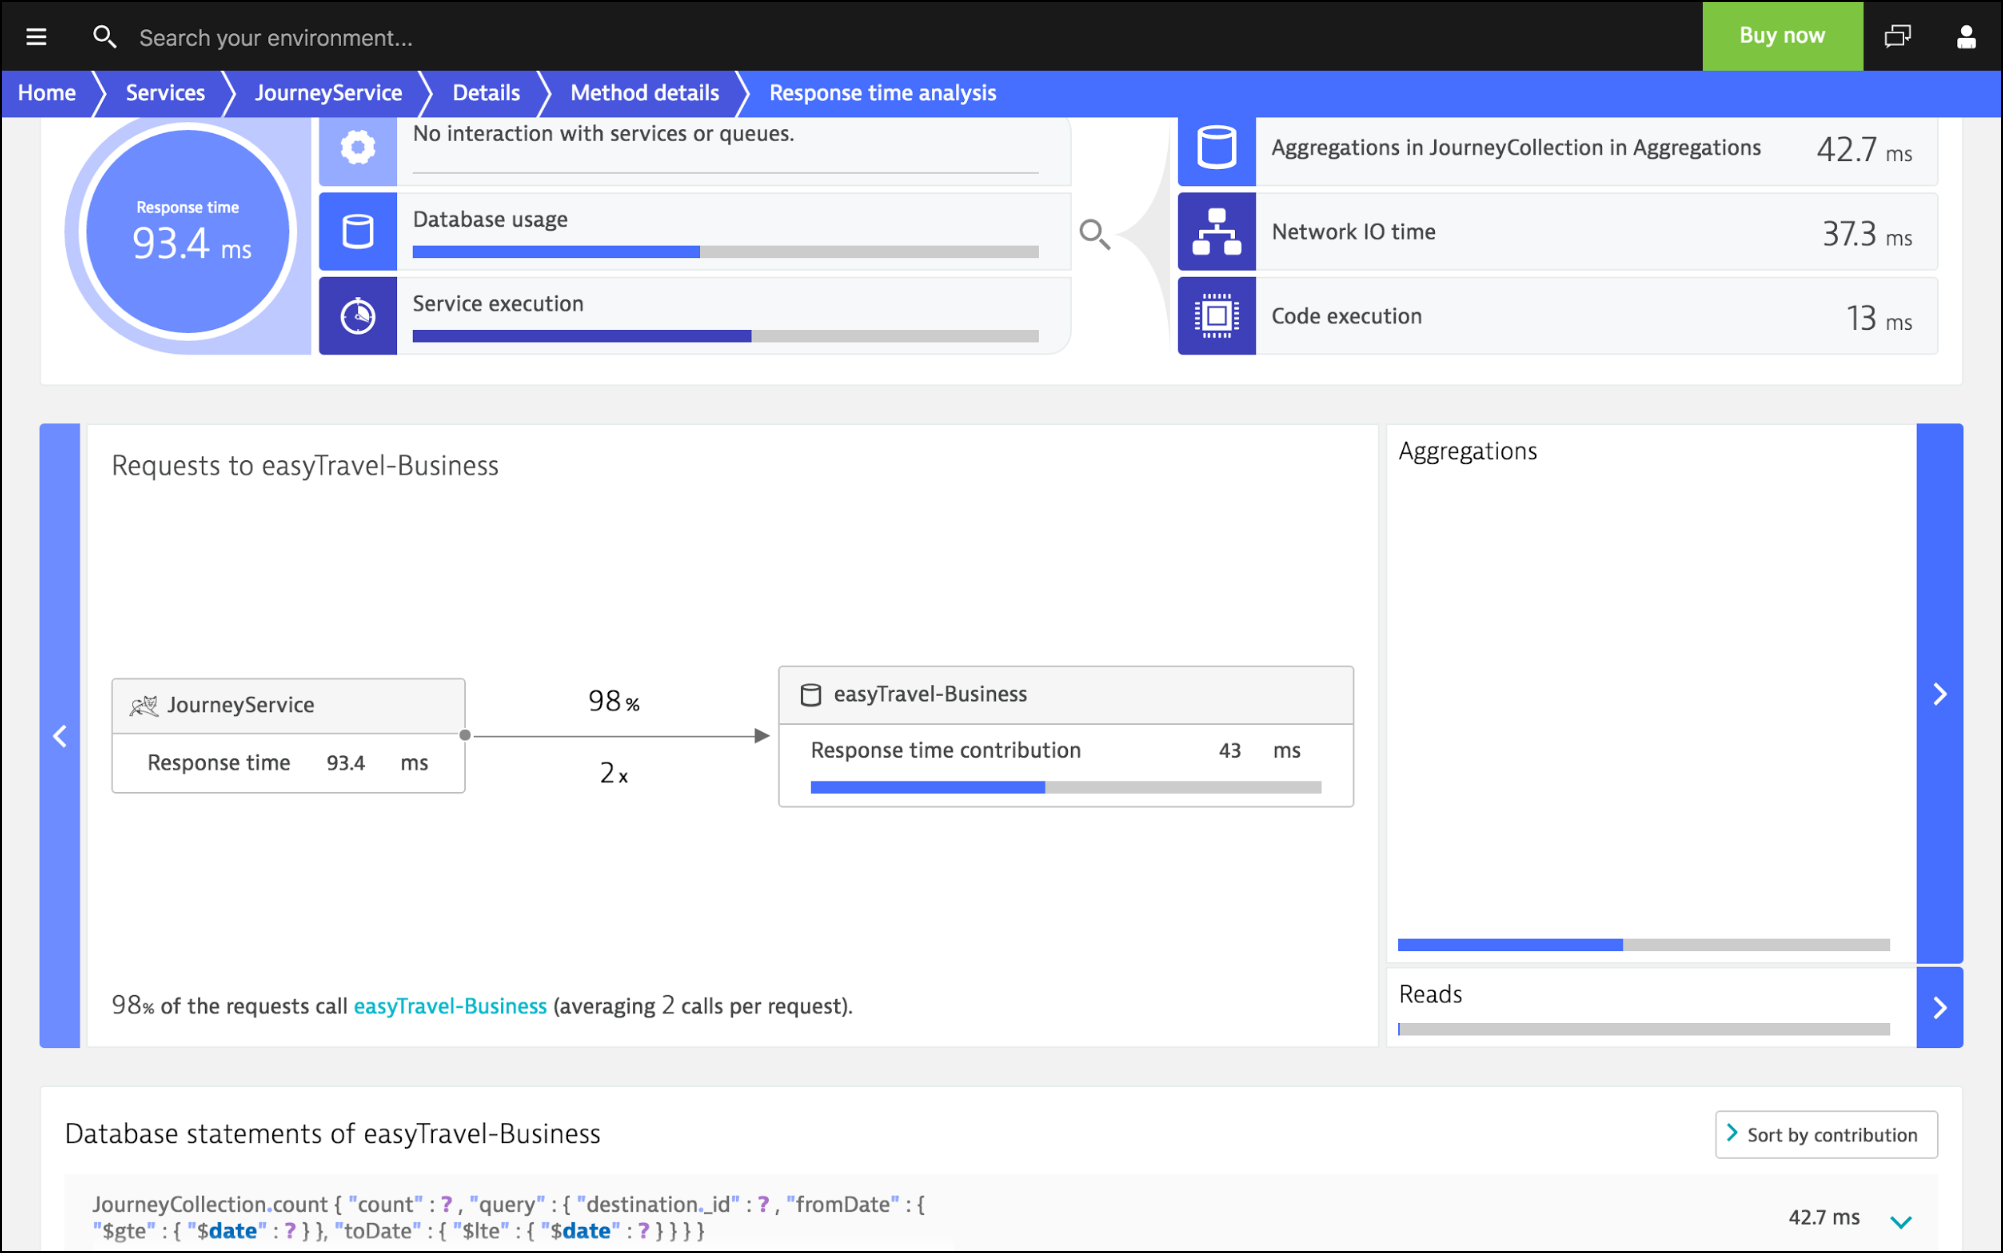
Detailed response time contribution breakdown for service methods
-
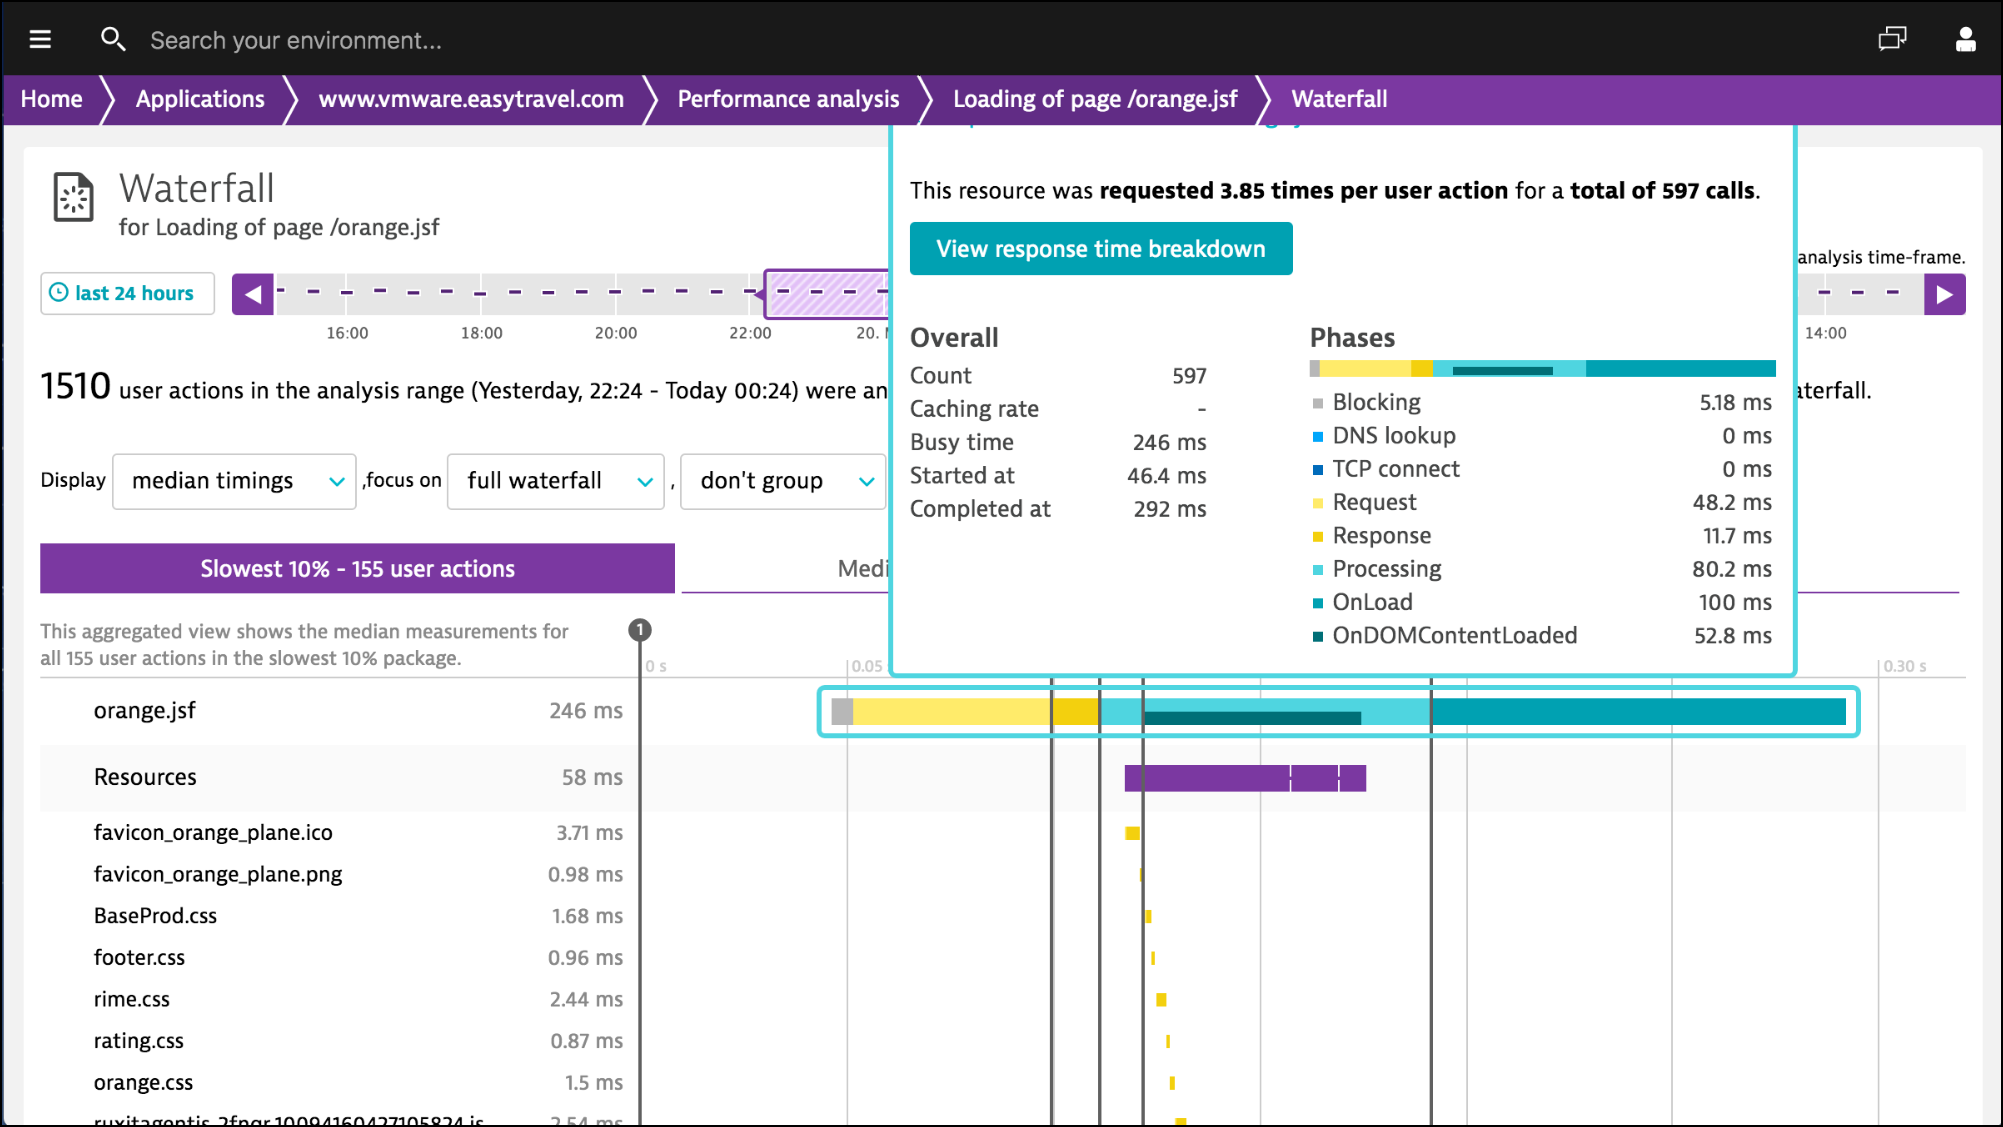
Detailed waterfall performance breakdown for webpages
-
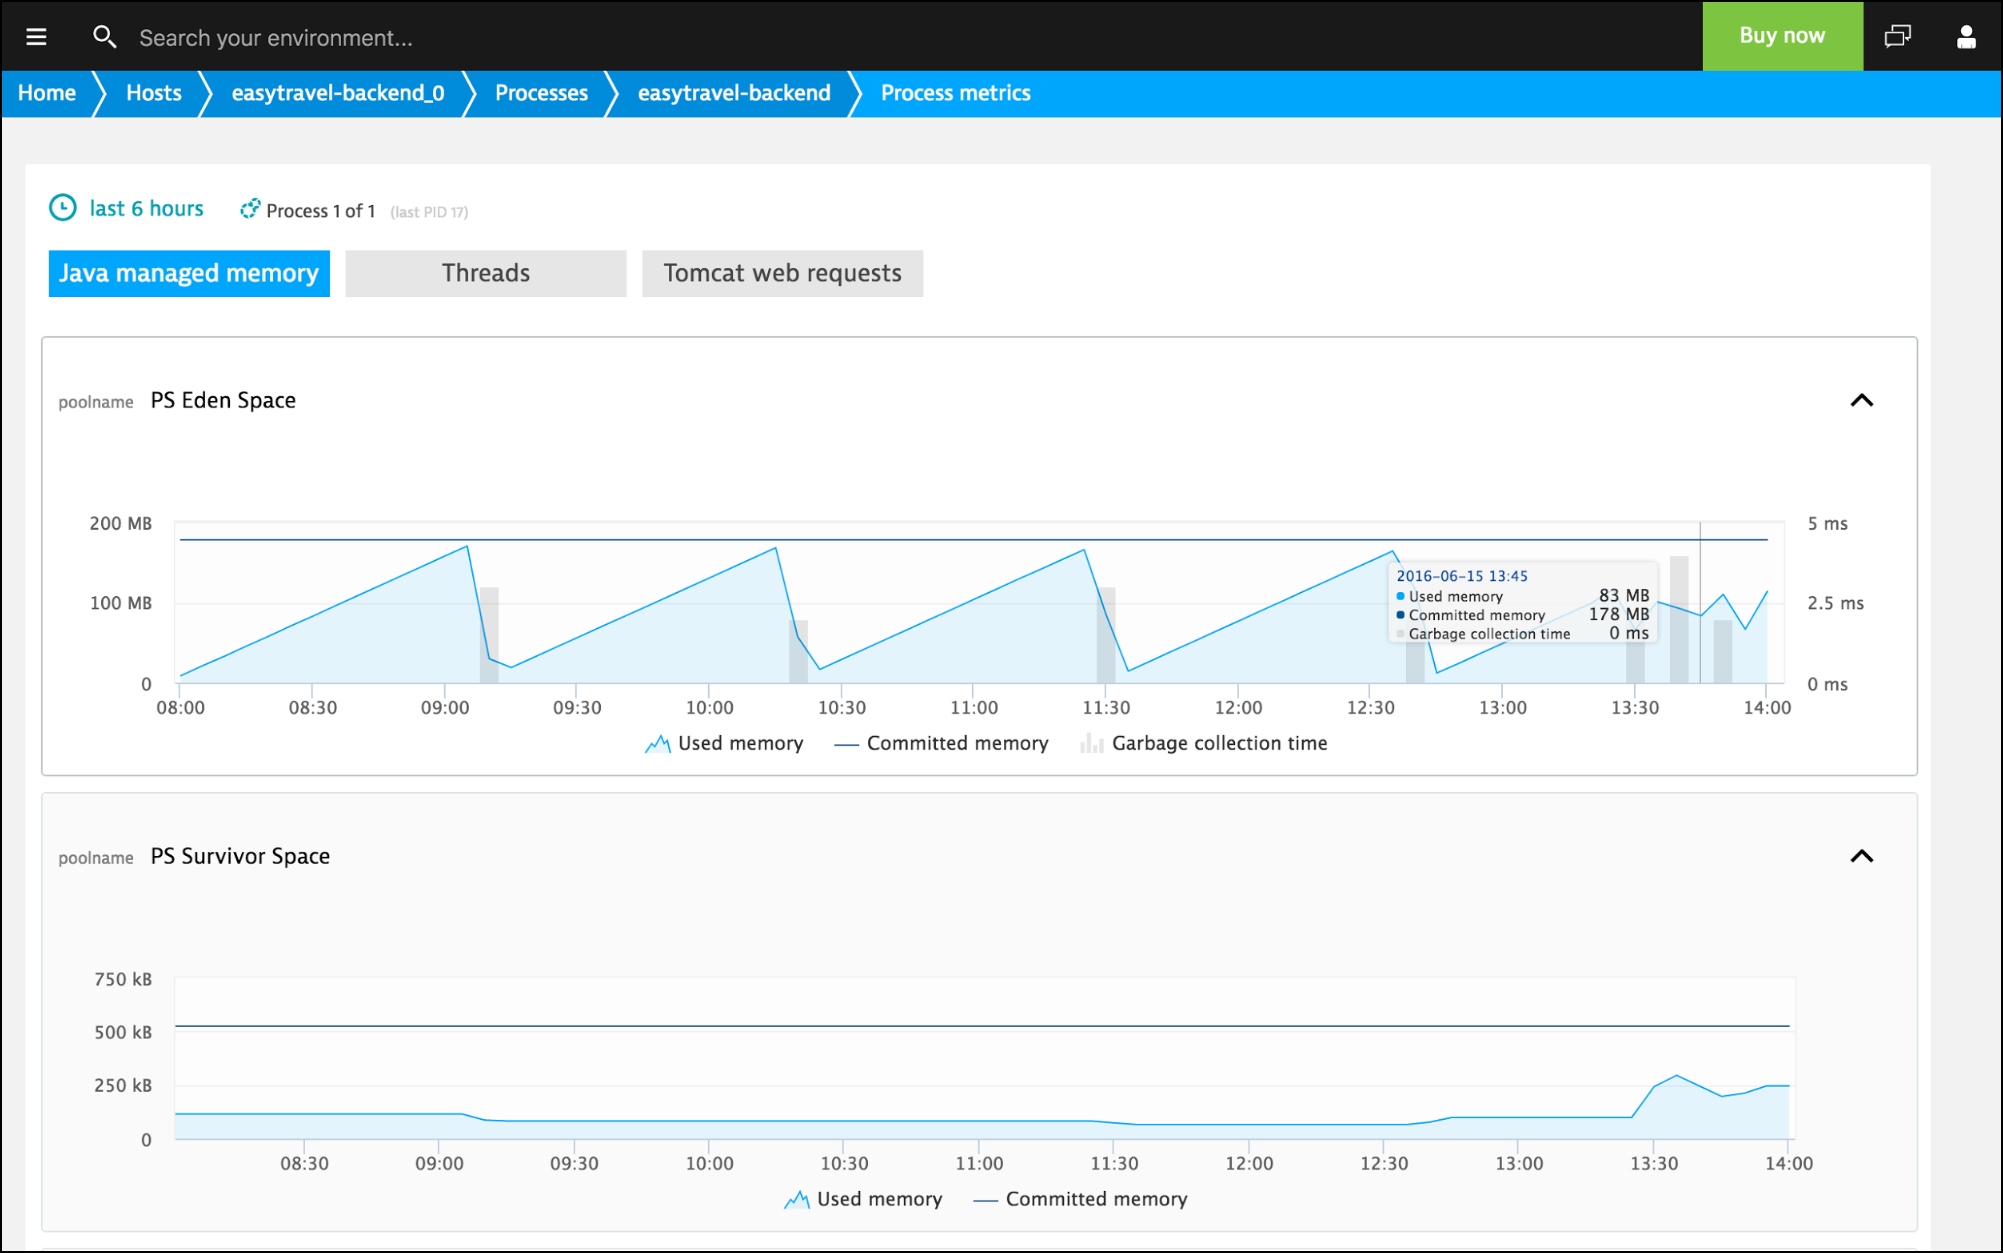
Java managed memory metrics
-
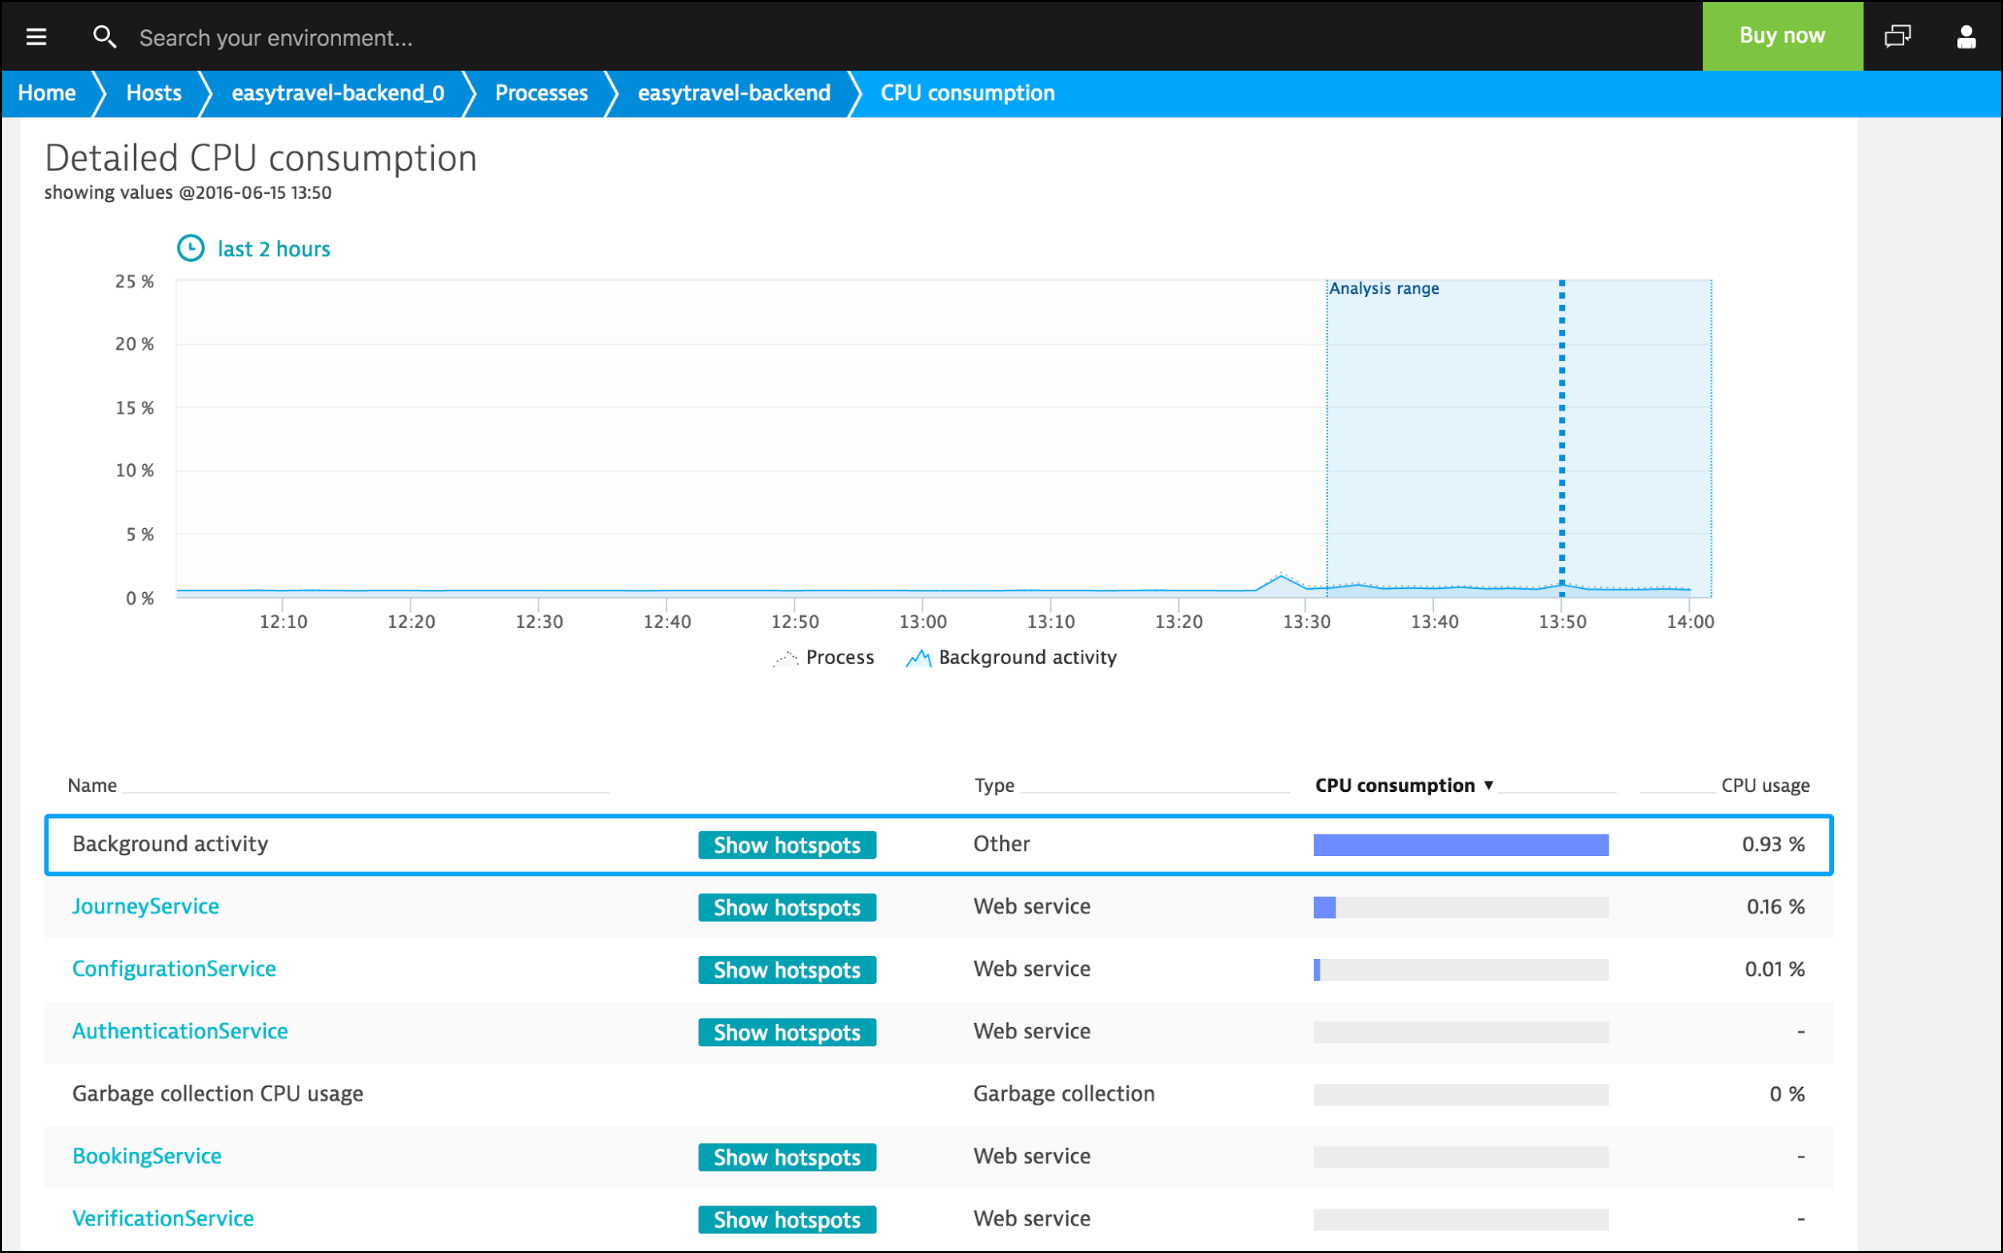
Detailed CPU consumption break-down per process
