


This topic describes the architecture of the Healthwatch™ for VMware Tanzu® (Healthwatch), Healthwatch Exporter for VMware Tanzu® Application Service™ (TAS for VMs), and Healthwatch Exporter for VMware Tanzu® Kubernetes Grid™ Integrated Edition (TKGI) tiles. This topic also describes the possible configurations for monitoring metrics across multiple VMware Tanzu® Operations Manager™ (Ops Manager) foundations.
Overview of Healthwatch Architecture
There are three tiles that form the Healthwatch architecture: Healthwatch, Healthwatch Exporter for TAS for VMs, and Healthwatch Exporter for TKGI.
A complete Healthwatch installation includes the Healthwatch tile, as well as at least one Healthwatch Exporter tile. However, you can deploy and use each tile separately as part of an alternate monitoring configuration.
You must install a Healthwatch Exporter tile on each Ops Manager foundation you want to monitor. You can install the Healthwatch tile on the same Ops Manager foundation or on a different Ops Manager foundation, depending on your desired monitoring configuration.
You can also configure the Healthwatch Exporter tiles to expose metrics to a service or database located outside your Ops Manager foundation, such as an external time-series database (TSDB) or an installation of the Healthwatch tile on a separate Ops Manager foundation. This does not require you to install the Healthwatch tile.
For a detailed explanation of the architecture for each tile, a list of open ports required for each component, and the possible configurations for monitoring metrics across Ops Manager foundations, see the following sections:
Healthwatch Tile Architecture
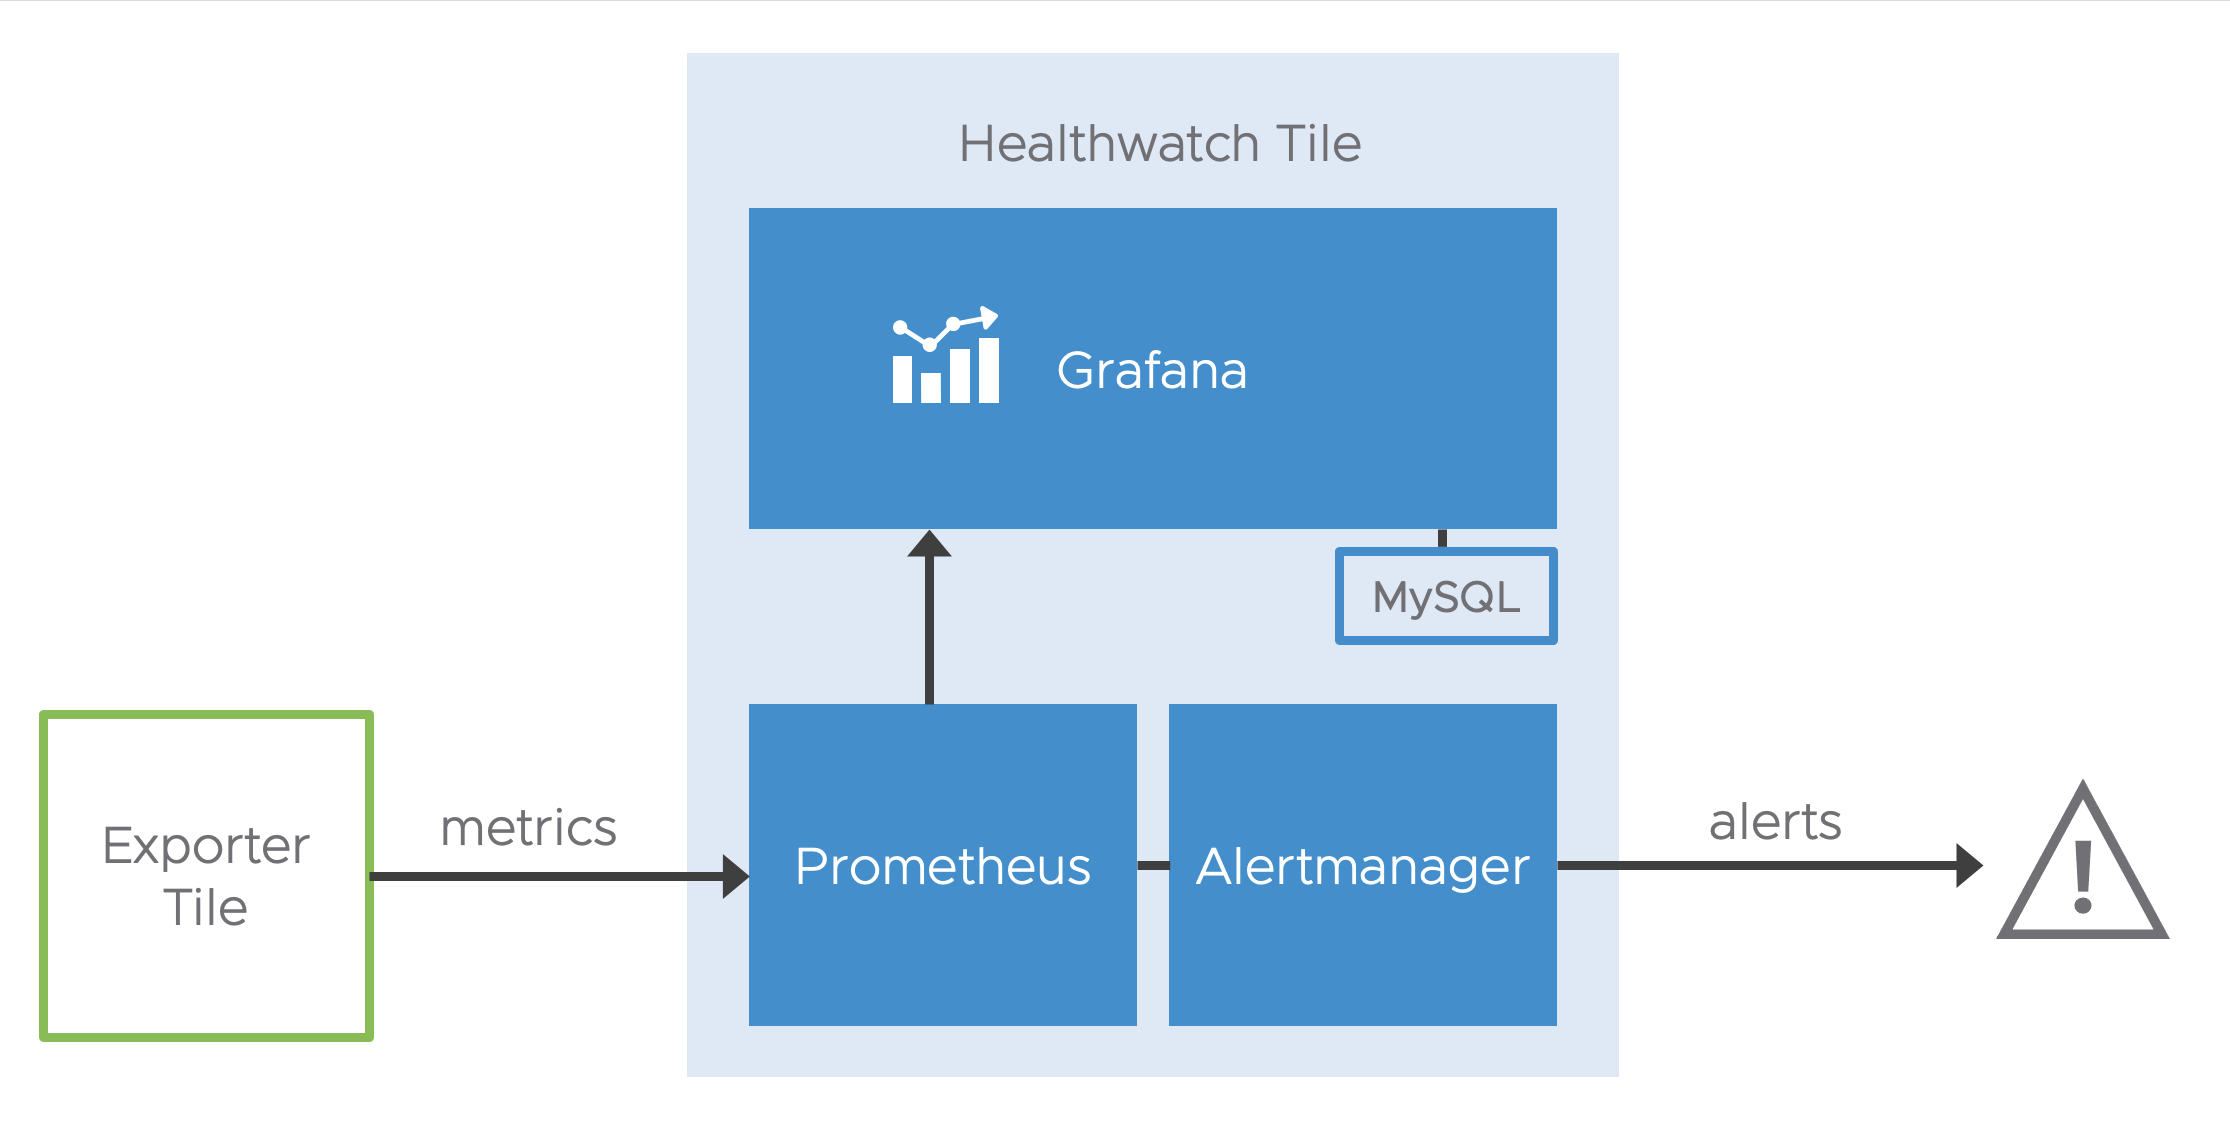
When you install the Healthwatch tile, Healthwatch deploys instances of Prometheus, Grafana, and MySQL. Healthwatch also deploys an Nginx proxy in front of the Prometheus instance for load-balancing.
The Prometheus instance scrapes and stores metrics from the Prometheus endpoints on the metric exporter VMs that the Healthwatch Exporter tiles deploy. Prometheus also allows you to configure alerts with Alertmanager.
Healthwatch then exports these metrics to dashboards in the Grafana UI, where you can visualize the data in charts and graphs. You can also use Grafana to create customized dashboards for long-term monitoring and troubleshooting.
Note: The MySQL instance that the Healthwatch tile deploys only stores your Grafana settings, and does not store any time-series data.
The diagram below illustrates how metrics travel from the Healthwatch Exporter tiles through Prometheus and to Grafana. It also shows how metrics travel through Prometheus to Alertmanager.
High Availability
You can deploy the Healthwatch tile in high availability (HA) mode with three MySQL nodes and two MySQL Proxy nodes, or in non-HA mode with one MySQL node and one MySQL Proxy node.
Component Scaling
Healthwatch deploys two Prometheus VMs by default to create an HA Prometheus instance. If you do not need Prometheus to be HA, you can scale the Prometheus instance vertically to one Prometheus VM. To further scale the Prometheus instance, you can scale it horizontally by increasing the disk size of each VM in the Prometheus instance.
Healthwatch deploys a single Grafana VM by default. If you want to make the Grafana instance HA, you can scale the Grafana instance horizontally.
If you do not want to use any Grafana instances in your Healthwatch deployment, you can set the number of Grafana, MySQL, and MySQL Proxy instances for your Healthwatch deployment to 0 in the Resource Config pane of the Healthwatch tile.
For more information about scaling Healthwatch resources, see Healthwatch Components and Resource Requirements.
Networking Rules for the Healthwatch Tile
The table below describes the ports you must open for each Healthwatch component:
| This component … | Must communicate with … | Default TCP Port | Notes |
|---|---|---|---|
grafana |
|
|
Additional networking rules may be required for any external connections listed. For example, 443 for UAA. |
blackbox-exporter |
External canary target URLs | N/A | Additional networking rules may be required, depending on your external canary target URL configuration. |
tsdb |
|
9090 |
|
tsdb (for TKGI cluster discovery) |
For each cluster:
|
|
You only need to open these ports if you configure TKGI cluster discovery. |
Healthwatch Exporter for TAS for VMs Architecture
The Healthwatch Exporter for TAS for VMs tile deploys metric exporter VMs to generate each type of metric related to the health of your TAS for VMs deployment.
Healthwatch Exporter for TAS for VMs sends metrics through the Loggregator Firehose to a Prometheus exposition endpoint on the associated metric exporter VMs. The Prometheus instance that exists within your metrics monitoring system then scrapes the exposition endpoints on the metric exporter VMs and imports those metrics into your monitoring system.
You can scale the VMs that Healthwatch Exporter for TAS for VMs deploys vertically, but should not scale them horizontally.
Networking Rules for Healthwatch Exporter for TAS for VMs
The table below describes the ports you must open for each Healthwatch Exporter for TAS for VMs component:
| This component … | Must communicate with … | Default TCP Port |
|---|---|---|
bosh-deployments-exporter |
|
|
bosh-health-exporter |
|
|
cert-expiration-exporter |
Ops Manager | 443 |
pas-exporter-counter |
Reverse Log Proxy (RLP) nozzle | 8082 |
pas-exporter-gauge |
RLP nozzle | 8082 |
pas-sli-exporter |
|
|
Healthwatch Exporter for TKGI Architecture
The Healthwatch Exporter for TKGI tile deploys metric exporter VMs to generate SLIs related to the health of your TKGI deployment.
The Prometheus instance that exists within your metrics monitoring system then scrapes the Prometheus exposition endpoints on the metric exporter VMs and imports those metrics into your monitoring system.
You can scale the VMs that Healthwatch Exporter for TKGI deploys vertically, but should not scale them horizontally.
Networking Rules for Healthwatch Exporter for TKGI
The table below describes the ports you must open for each Healthwatch Exporter for TKGI component:
| This component … | Must communicate with … | Default TCP Port |
|---|---|---|
bosh-deployments-exporter |
|
|
bosh-health-exporter |
|
|
cert-expiration-exporter |
Ops Manager | 443 |
pks-exporter |
|
|
pks-sli-exporter |
|
|
Configuration Options
Healthwatch can be configured in multiple ways, allowing you to monitor metrics across a variety of platform and foundation configurations. The sections below describe the most common configuration scenarios:
Monitoring TAS for VMs on a Single Ops Manager Foundation
If you only want to monitor a single Ops Manager foundation that has TAS for VMs installed, install the Healthwatch tile and Healthwatch Exporter for TAS for VMs on the same foundation. The Healthwatch tile automatically detects Healthwatch Exporter for TAS for VMs on the same Ops Manager foundation and adds a scrape job for Healthwatch Exporter for TAS for VMs to the Prometheus instance.
For more information about installing and configuring the Healthwatch tile and Healthwatch Exporter for TAS for VMs, see the following topics:
-
Installing a Tile Manually or Installing, Configuring, and Deploying a Tile Through an Automated Pipeline
Monitoring TKGI on a Single Ops Manager Foundation
If you only want to monitor a single Ops Manager foundation that has TKGI installed, install the Healthwatch tile and Healthwatch Exporter for TKGI on the same foundation. The Healthwatch tile automatically detects Healthwatch Exporter for TKGI on the same Ops Manager foundation and adds a scrape job for Healthwatch Exporter for TKGI to the Prometheus instance.
For more information about installing and configuring the Healthwatch tile and Healthwatch Exporter for TKGI, see the following topics:
-
Installing a Tile Manually or Installing, Configuring, and Deploying a Tile Through an Automated Pipeline
Monitoring TAS for VMs and TKGI on a Single Ops Manager Foundation
If you only want to monitor a single Ops Manager foundation that has both TAS for VMs and TKGI installed, install the Healthwatch tile, Healthwatch Exporter for TAS for VMs, and Healthwatch Exporter for TKGI on the same foundation. The Healthwatch tile automatically detects Healthwatch Exporter for TAS for VMs and Healthwatch Exporter for TKGI on the same Ops Manager foundation and adds scrape jobs for both Healthwatch Exporter tiles to the Prometheus instance.
For more information about installing and configuring the Healthwatch tile, Healthwatch Exporter for TAS for VMs, and Healthwatch Exporter for TKGI, see the following topics:
-
Installing a Tile Manually or Installing, Configuring, and Deploying a Tile Through an Automated Pipeline
Configure Multi-Foundation Monitoring Using Direct Scraping
You can monitor several Ops Manager foundations from a single monitoring Ops Manager foundation using direct scraping.
When you configure direct scraping for your multi-foundation Healthwatch deployment, the Prometheus instance in the Healthwatch tile on a monitoring Ops Manager foundation scrapes metrics directly from the metric exporter VMs deployed by the Healthwatch Exporter tiles installed on the Ops Manager foundation you monitor.
To configure your Healthwatch deployment to monitor several Ops Manager foundations from a single monitoring Ops Manager foundation using direct scraping, see Configure Multi-Foundation Monitoring Using Direct Scraping in Configuring Multi-Foundation Monitoring.
Configure Multi-Foundation Monitoring Using Federation
You can monitor several Ops Manager foundations from a single monitoring Ops Manager foundation using federation.
When you configure federation for your multi-foundation Healthwatch deployment, the Prometheus instance in the Healthwatch tile on a monitoring Ops Manager foundation scrapes a subset of metrics from the Prometheus instances in the Healthwatch tiles installed on the Ops Manager foundations you monitor.
To configure your Healthwatch deployment to monitor several Ops Manager foundations from a single monitoring Ops Manager foundation using federation, see Configure Multi-Foundation Monitoring Using Federation in Configuring Multi-Foundation Monitoring.
