The SDDC vRealize Operations Manager Sizing Dashboard provides vRealize Operations Manager cluster capacity to process object and metrics. The dashboard displays information of whether the vRealize Operations Manager deployment is within the sizing guideline of vRealize Operations Manager. It provides sizing indication for a vRealize Operations Manager cluster, data nodes, and remote collector nodes. It also provides the maximum number of nodes that can be added in the vRealize Operations Manager cluster for a deployed node type.
For details on
vRealize Operations Manager Sizing, see KB article
2093783.
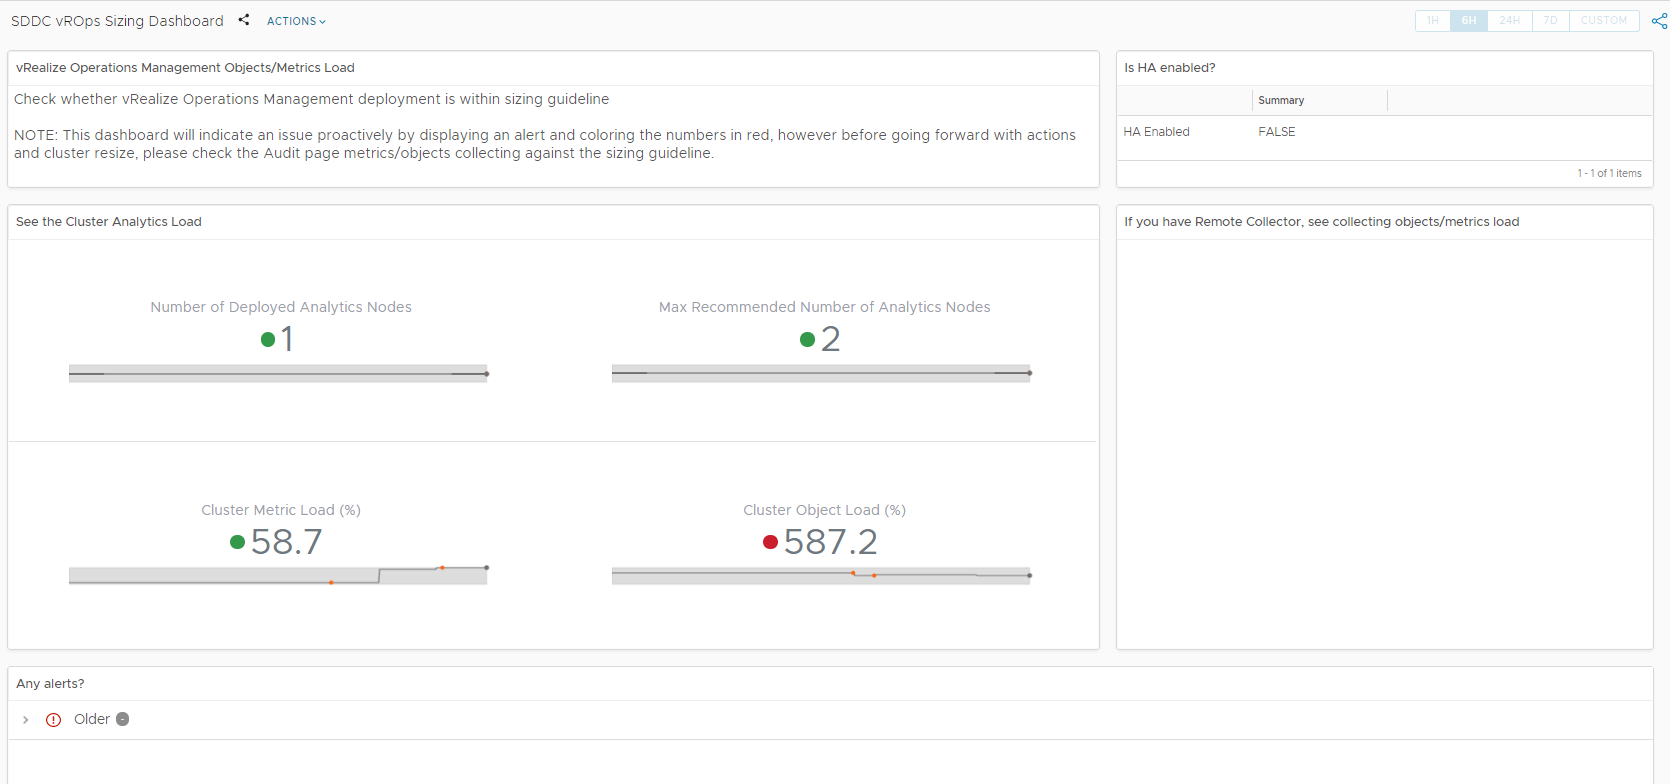
Figure 1. SDDC
vRealize Operations Manager Sizing Dashboard
The dashboard displays several widgets.
Note: This dashboard indicates an issue by displaying an alert and coloring the numbers in red. However, before going ahead with further actions and cluster resize, check the Audit page (
Administration >
History >
Audit) metrics/objects collection against the sizing guideline.
Table 1. Widgets in the Sizing Dashboard
Widgets
Description
vRealize Operations Manager Objects/Metrics Load
This widget provides deployment information of vRealize Operations Manager is within the sizing guideline.
Is HA enabled?
The widget checks if HA is enabled for a deployed cluster.
See the Cluster Analytics Load
The widget provides information of the number of nodes in the cluster, with the percentage of nodes in metric load and object load. It displays the load calculation for analytic nodes.
If you have Remote Collector, see collecting objects/metrics
This widget provides information of object load and metric load in vRealize Operations Manager. The widget displays load calculation for remote collectors.
Any Alerts?
The widget provides alerts pertaining to sizing, node recommendations, metric, and object load for analytic and remote collector nodes.
Max Recommended Number of Analytics Nodes
The widget provides the maximum number of nodes that can be added in the vRealize Operations Manager cluster for a deployed node type.