


You can use the dashboards to view the management pack contents.
Access the Dashboards
- To access the dashboards, from the main menu of VMware vRealize Operations Manager, click Dashboards.
-
From the dashboard list, select the AppDynamics Application Troubleshooting dashboard.
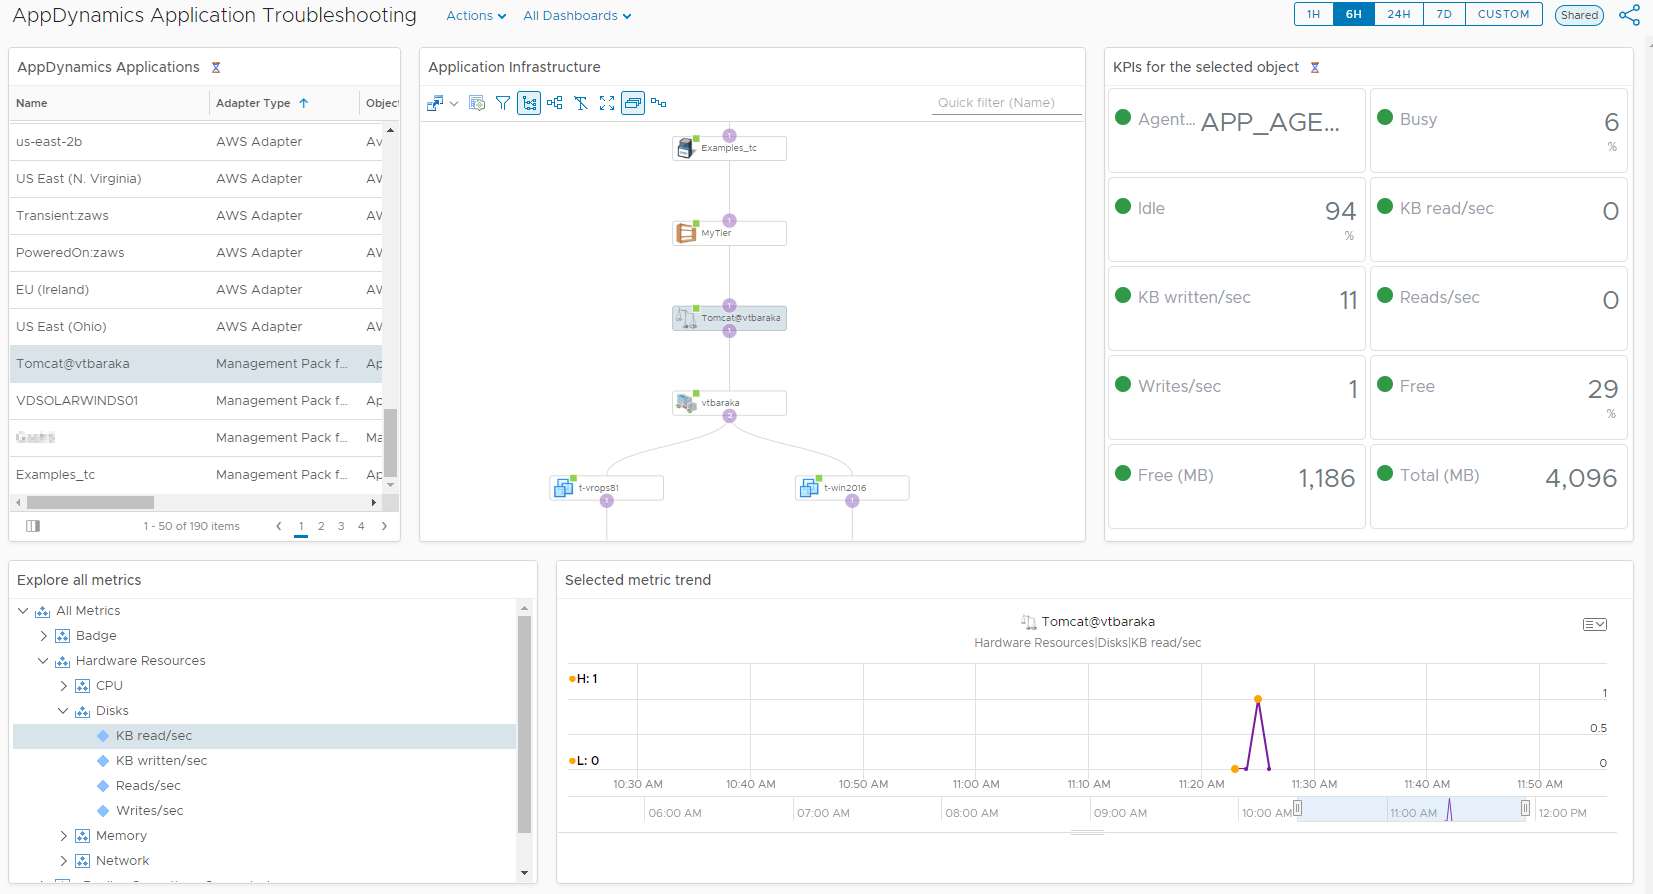
The AppDynamics Application Troubleshooting dashboard provides an overview of the discovered AppDynamics resources (Applications, Tiers, Nodes and Hosts). It displays the topology of a selected object, how it connects to other resources, and a view of the resource KPIs and collected metrics.
The dashboard displays several widgets:
| Widget | Description |
|---|---|
| AppDynamics Applications | Displays the list of AppDynamics Applications that are being monitored. When you select an object host in this widget, the other widgets in the AppDynamics dashboard display data for the selected resource. |
| Application Infrastructure Relationships | Displays a top-level view of the selected environment and following key components - AppDynamics Adapter Instance,AppDynamics Application,AppDynamics Tiers,AppDynamics Nodes,AppDynamics Hosts, Other related vROps resources (vCenter virtual machines, Amazon EC2 Instances, Azure Virtual Machines, Universes) |
| KPIs for the selected object | Displays all the user defined KPIs for the selected object |
| Explore all Metrics | Displays all the available metrics and properties for the selected object |
| Selected Metrics Trend | Displays graphical representation of the metrics selected in the Explore all Metrics widget. |
