If this product is in beta, keep and edit the warning note below.
Warning: The New Relic Cluster Monitoring for VMware Tanzu is currently in beta and is intended for evaluation and test purposes only. Do not use this product in a VMware PKS production environment.
This documentation describes New Relic Cluster Monitoring for VMware Tanzu.
New Relic Cluster Monitoring for VMware Tanzu collects kube-state-metrics from kubernetes clusters and makes it available in the Infrastructure module of your New Relic UI.

Overview
The Kubernetes integration enables NRI to collect kube-state-metrics from kubernetes clusters and report to your New Relic account for dashboarding and visualization, monitoring, alerting, and analytics purposes.
If you do not wish to use Helm chart, you can still use New Relic’s standard Kubernetes installation and configuration to install NRI agent in your kubernetes cluster.
Key Features
-
New Relic Infrastructure agent collects telemetry for the following components in your kubernetes clusters:
- Nodes
- Containers
- Pods
- Deployments
- Services
- Daemonsets
- Namespaces
- Replicasets
- Volume information
Additional documentation: Understand and use Kubernetes data
-
Pre-built dashboards in your New Relic account for viewing and analysis of Kubernetes metrics.
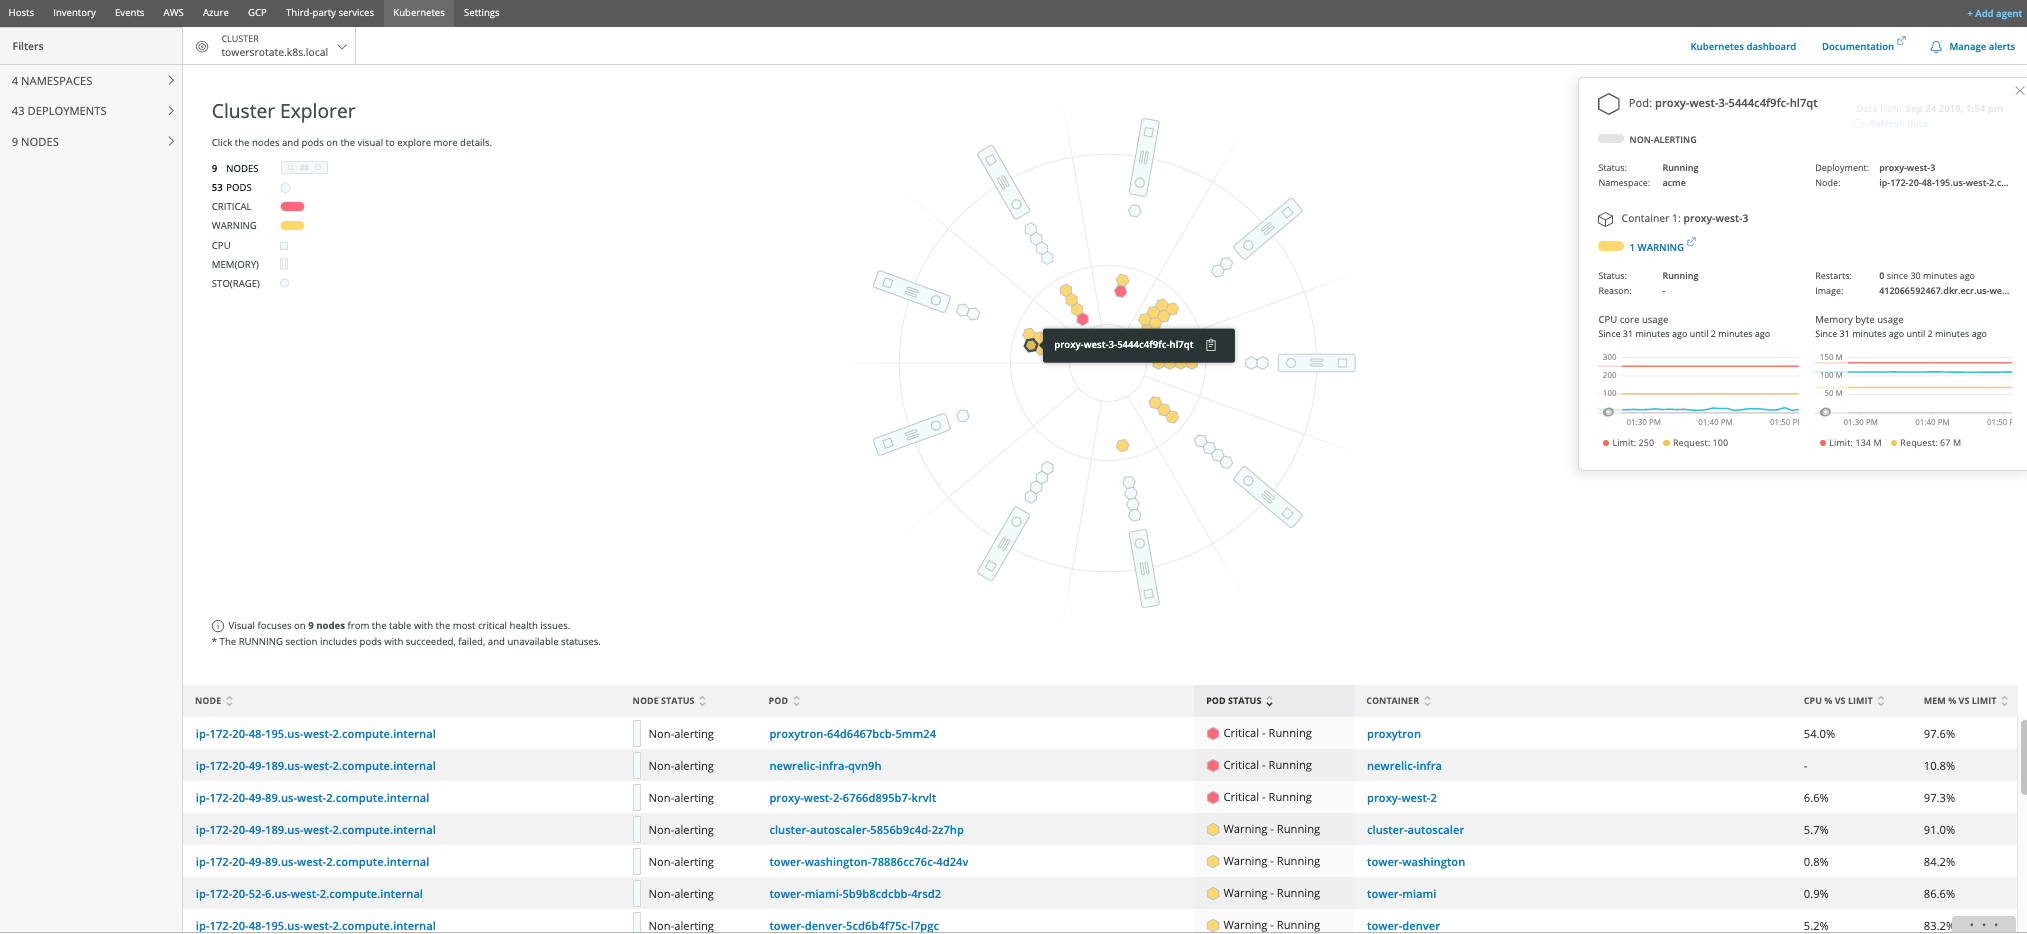
- Kubernetes Cluster Explorer to visualize and understand all aspects of your kubernetes clusters in one view.

- New Relic Alerting subsystem for proactively notifying SME’s of issues that need attention.
Product Snapshot
The following table provides version and version-support information for New Relic Cluster Monitoring for VMware Tanzu.
| Element | Details |
|---|---|
| Product version | 0.13.12 |
| Release date | Dec 5, 2019 |
| Software component version | New Relic Cluster Monitoring for VMware Tanzu 0.13.12 |
| Compatible VMware PKS versions | 1.3.3 up to and including 1.3.8 |
| BOSH stemcell version | Ubuntu Xenial |
| IaaS support | AWS, GCP, Azure, and vSphere |
Compatibility
This product has been tested with PAS v2.4, v2.5, v2.6, and v2.7. It supports VMware PKS v1.3.3 up to and including v1.3.8.
Requirements
New Relic Cluster Monitoring for VMware Tanzu has the following requirements:
- An active New Relic account with a Pro or Pro Trial license
- New Relic Infrastructure license
Trial License
If you do not already have a New Relic account, you can obtain a 14-day free trial license.
Feedback
If you have a feature request, questions, or information about a bug, please submit an issue on github.