Configure Prisma Cloud to secure your environment.
Review your Environment
After deploying Defenders to VMware Tanzu TAS, Prisma Cloud Defenders automatically gather security information about your environment.
Go to Radar > Containers to see your running apps. By default, nodes on the Radar canvas are color-coded by the highest serverity vulnerability detected in the container. Click on a node to inspect the security data collected for the containerized app, including vulnerability, compliance, and runtime issues.

Defender also automatically scans each Diego cell host for vulnerability and compliance issues. Go to Monitor > Vulnerabilities > Hosts and Monitor > Compliance > Hosts to review the information.
Scan Blobstores
To configure Prisma Cloud to scan a blobstore, do the following:
-
Log in to Prisma Cloud Compute Console.
-
Go to Defend > Vulnerabilities > VMware Tanzu Blobstore.
-
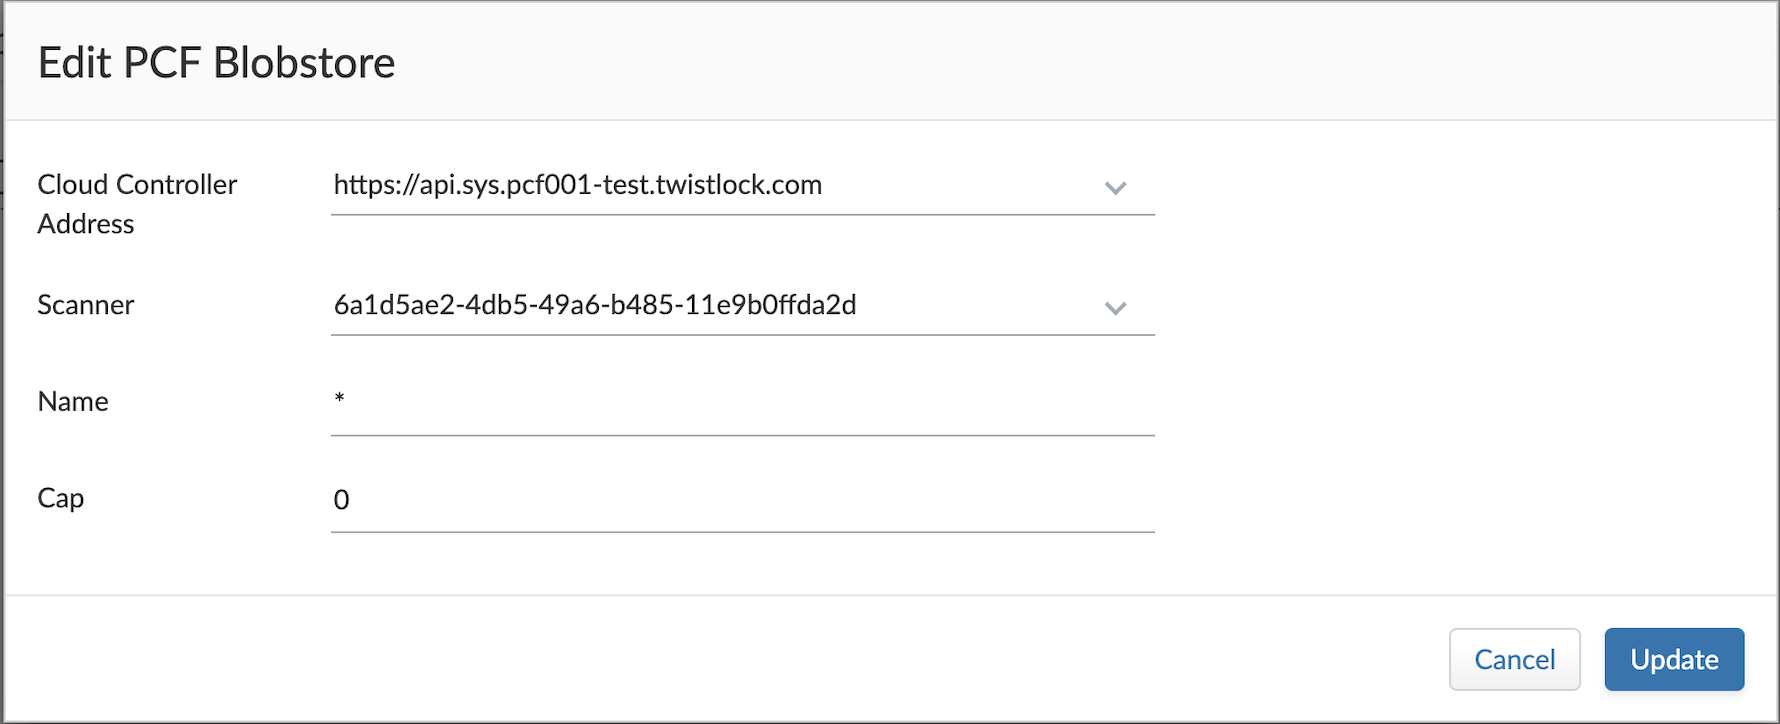
Click Add VMware Tanzu Blobstore settings.
-
Specify the cloud controller.
-
Specify the droplets to scan. To scan all droplets, enter a wildcard (*).
-
Specify the maxiumum number of droplets to scan. To scan all droplets, enter 0.
-
Click Add.
-
Click Save.
Scan Registries
You can also configure your deployed Defenders to scan your container registries. Use the standard setup procedure documented here.
Review Scan Reports
To review scan reports for VMware Tanzu blobstore droplets, do the following:
-
Log in to Prisma Cloud Compute Console.
-
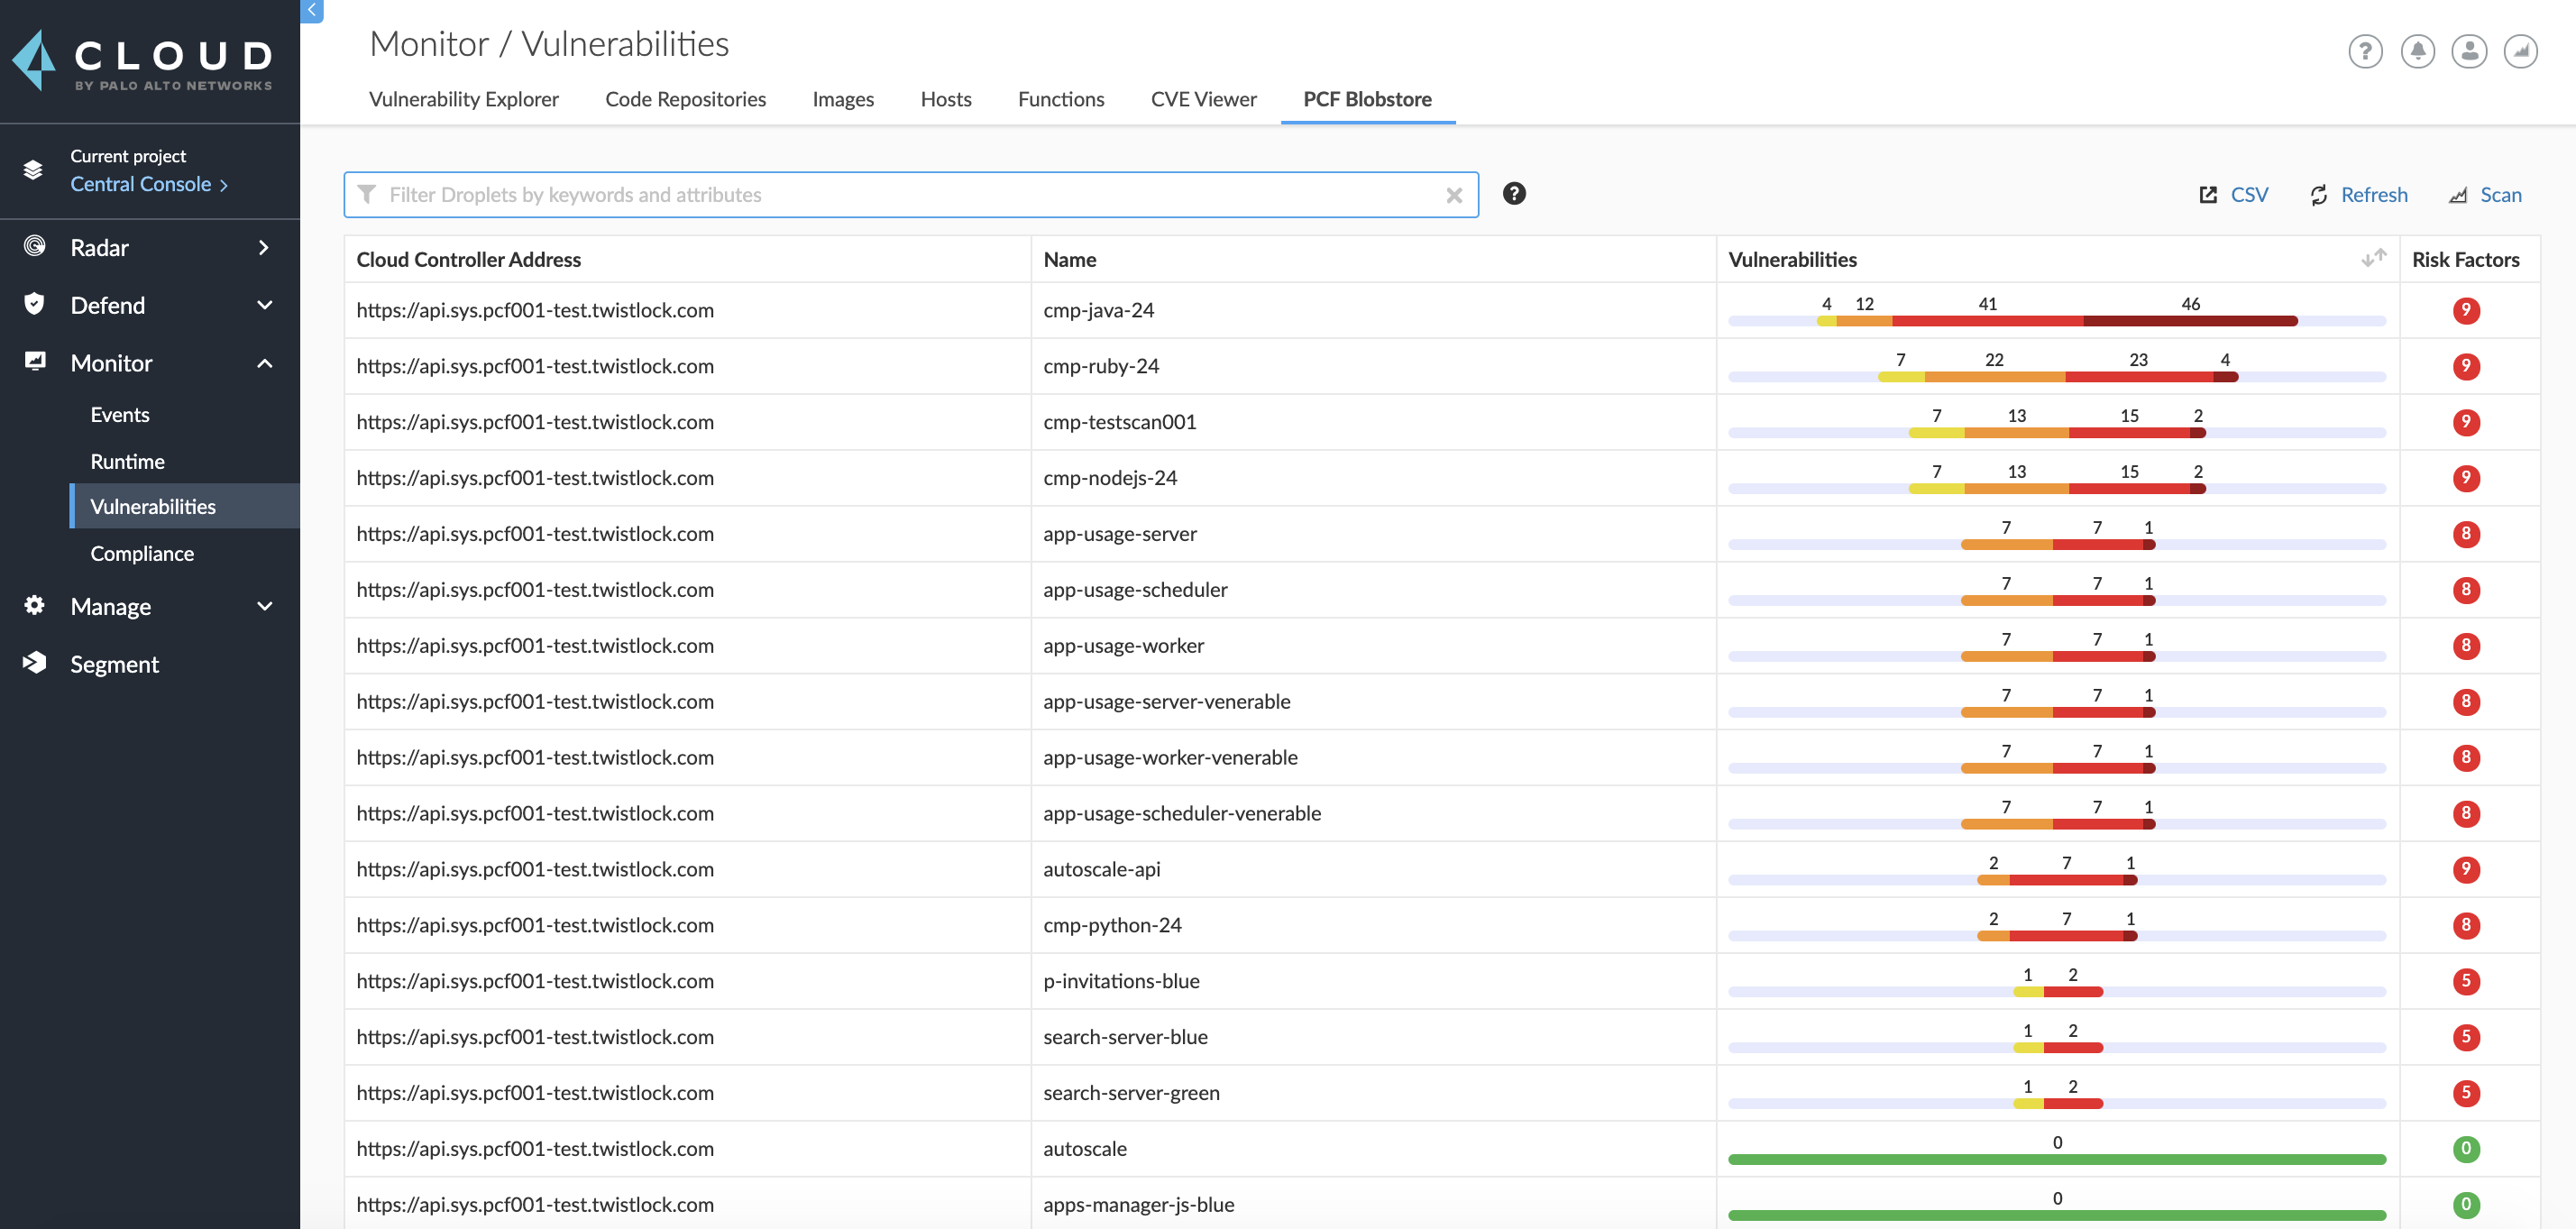
Go to Monitor > Vulnerabilities > VMware PCF Blobstore to see a list of summary reports for each droplet.
-
To drill into a specific scan report, click on a row in the table.
Runtime Protection
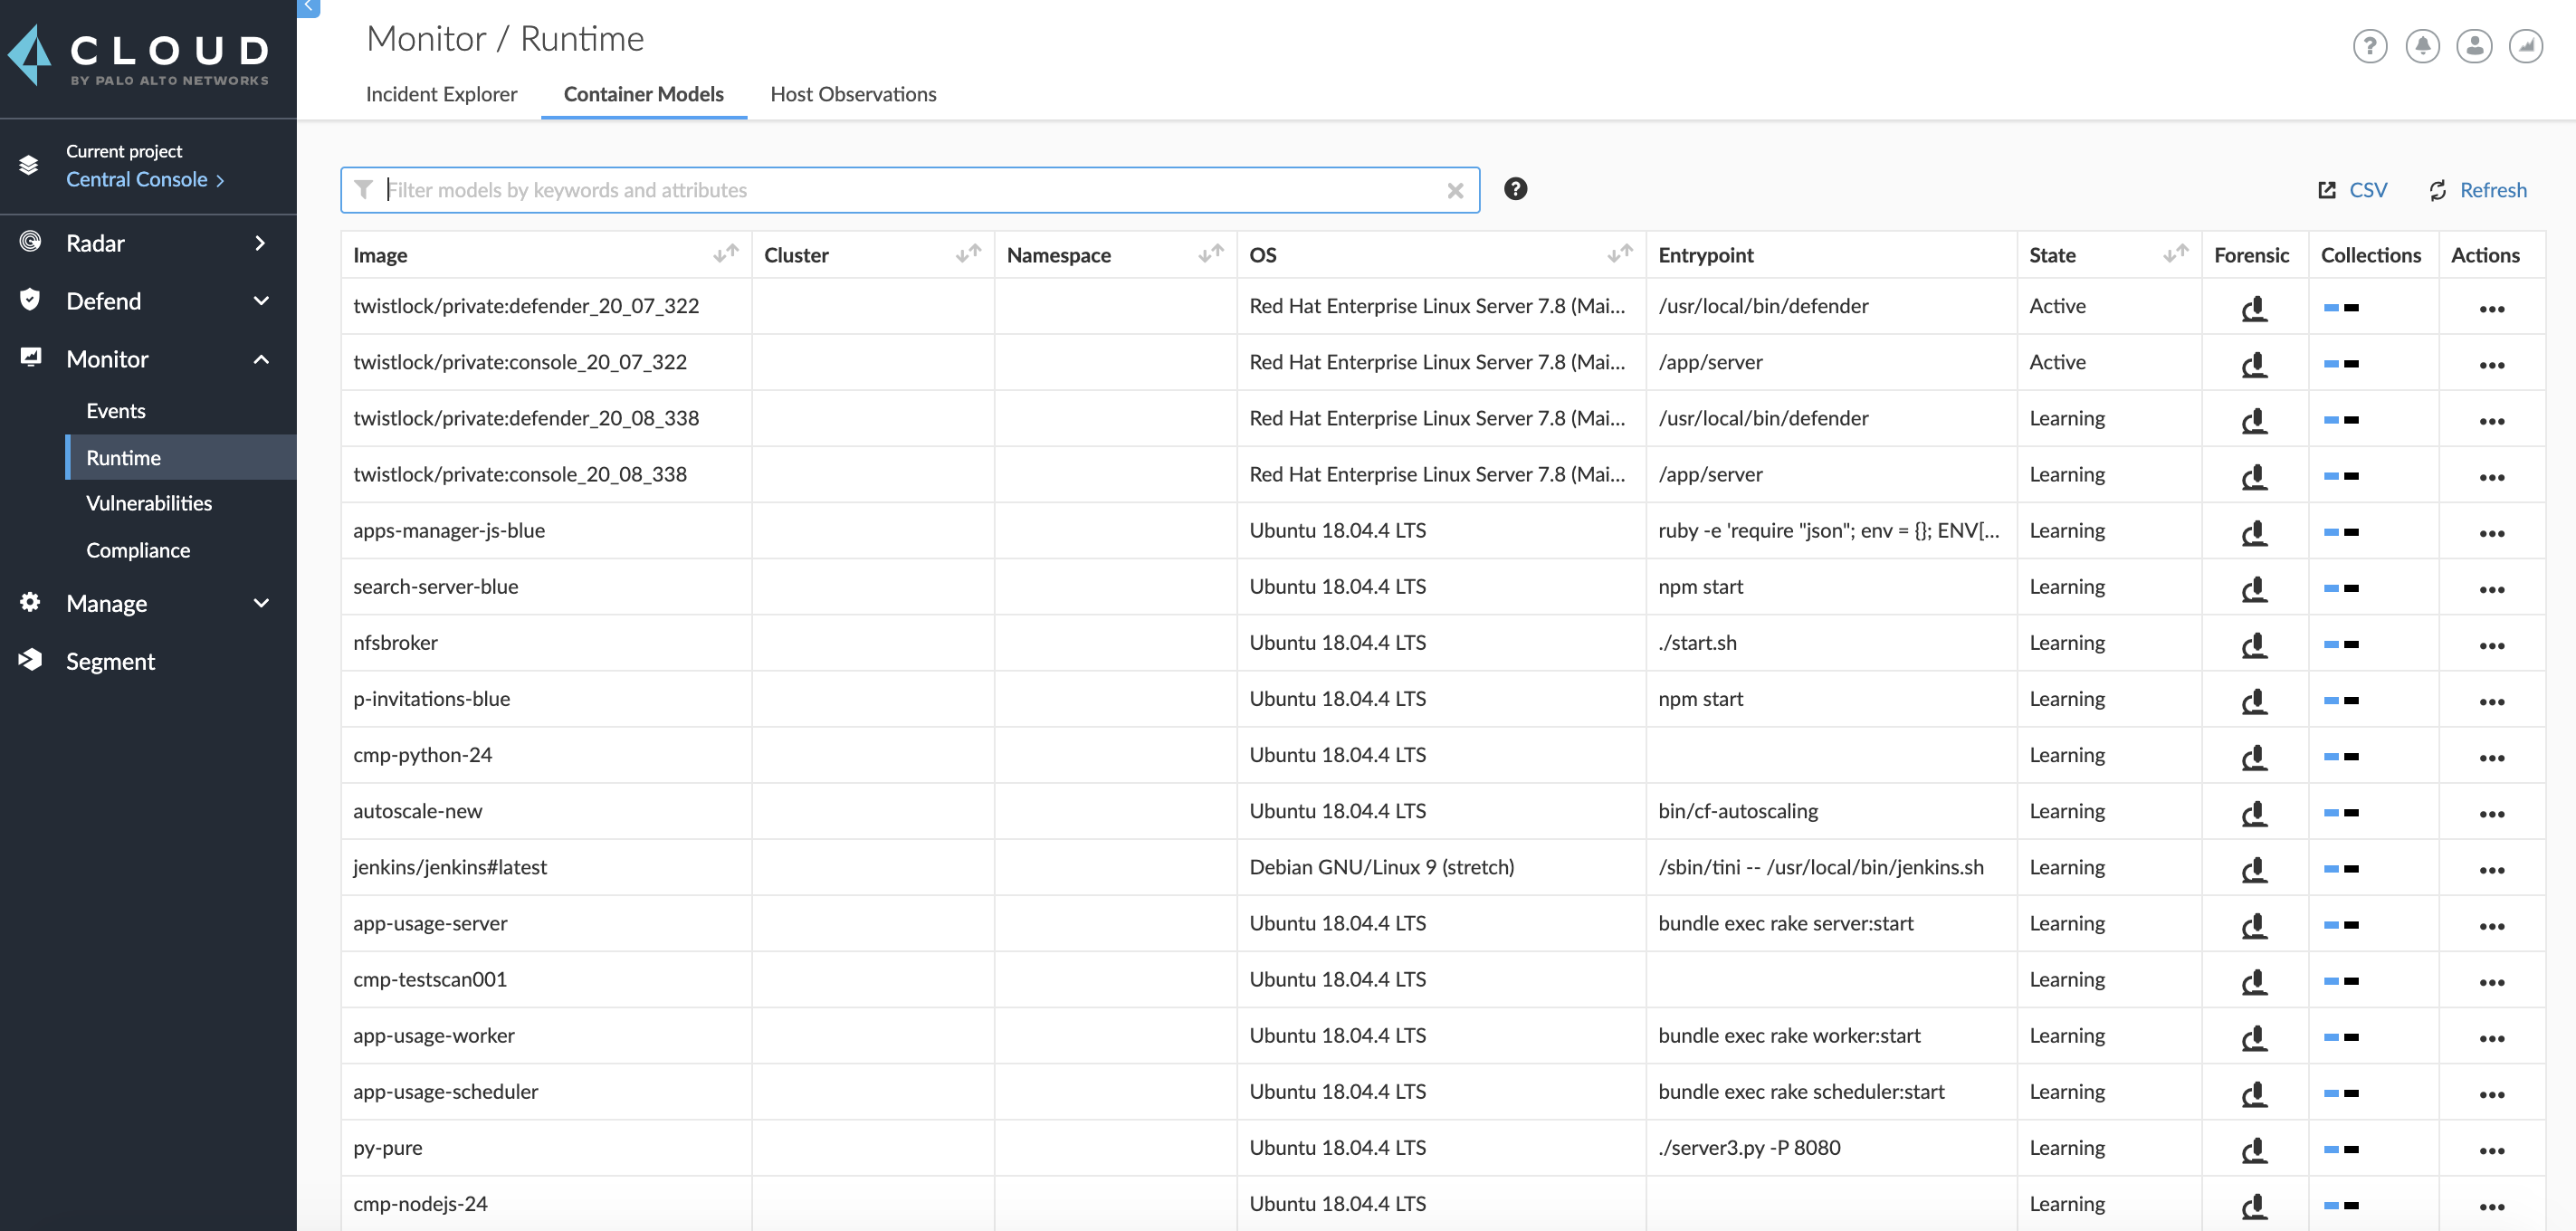
Prisma Cloud Defender uses machine learning to automatically model how apps were designed to run. To review the automatically generated models, go to Monitor > Runtime > Container Models.
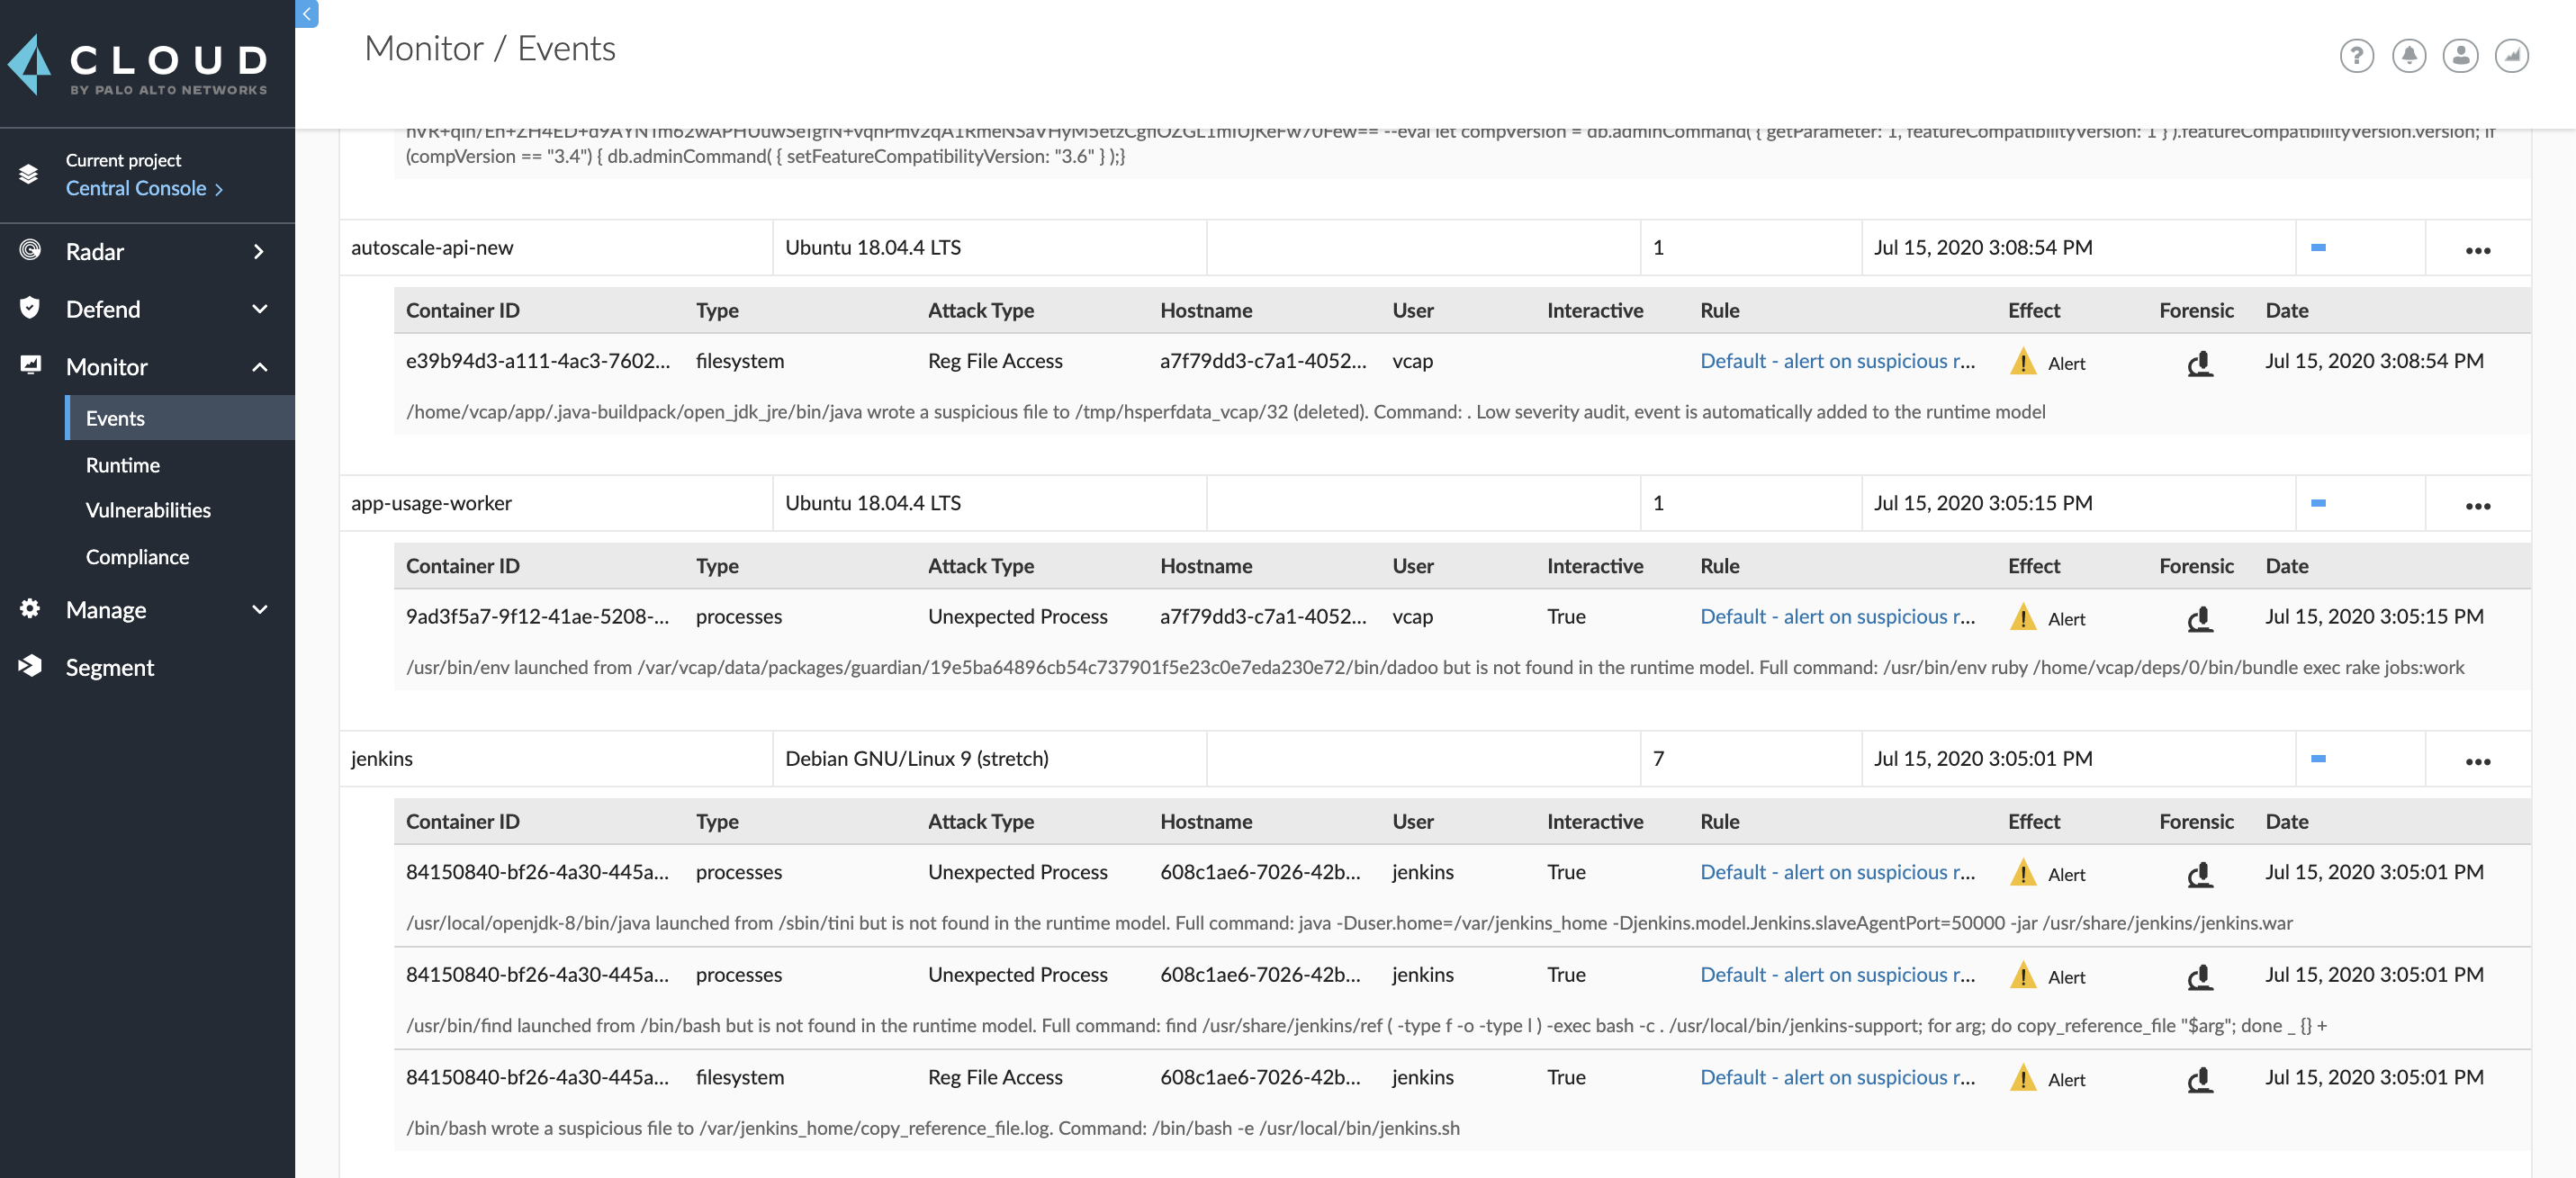
When an app does something that’s not modelled, Prisma Cloud generates an audit. There are many ways you can ingest audits into your monitoring system, including syslog. To review runtime alerts, go to Monitor > Events.
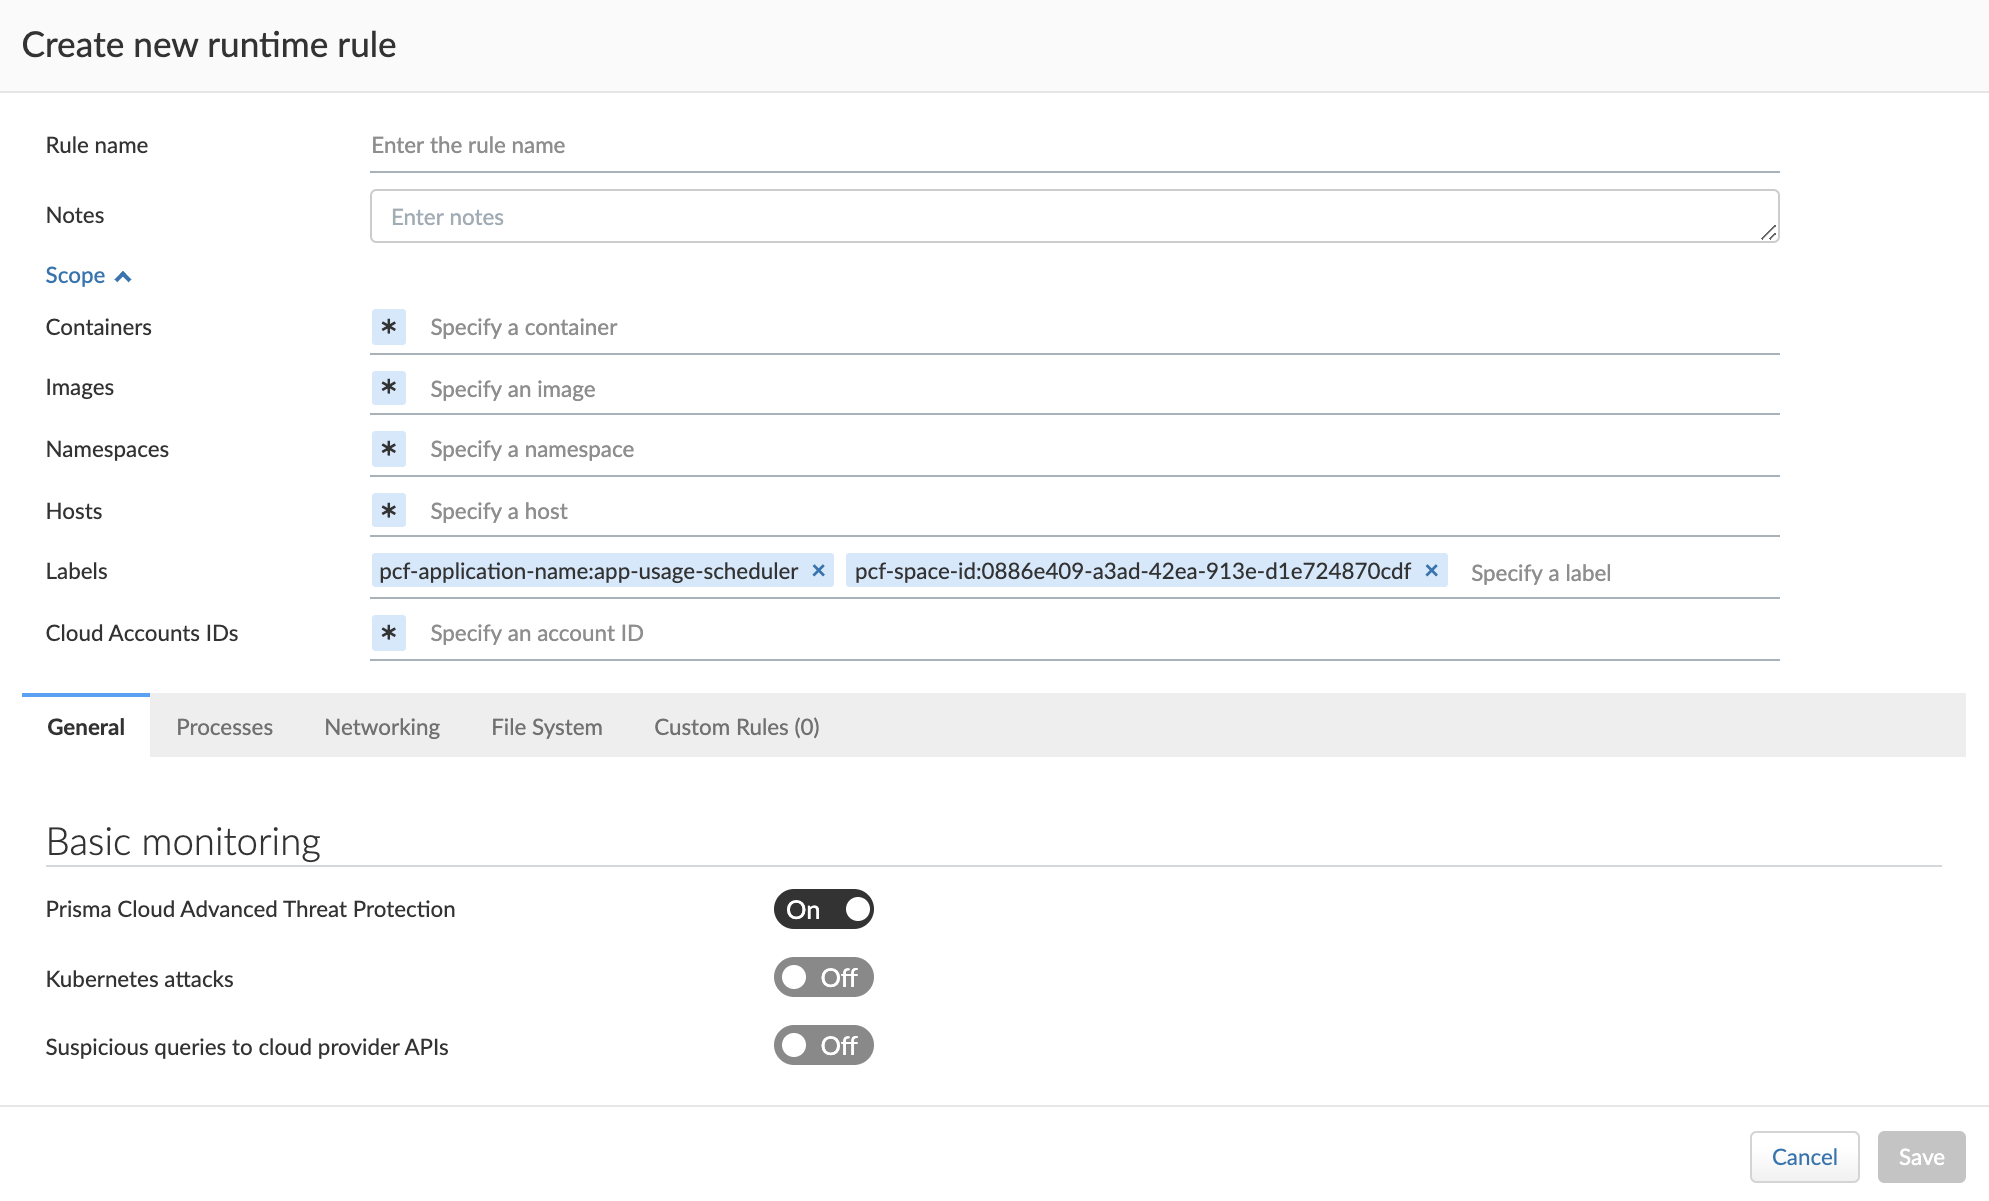
Sometimes, you might want to take more stringent blocking action rather than simply just alerting when Defender detects specific known-bad activity. Other times, the automatically generated models don’t fully capture what’s considered known-good behavior. In both cases, you can augment Prisma Cloud models with runtime rules. To create runtime rules, go to Defend > Runtime > Container Policy, and click Add Rule.
More Information
To learn how to set up scanning, configure policies, and send alerts, see the Prisma Cloud documentation.