


You can monitor the health of the Redis for VMware Tanzu Application Service service using the logs, metrics, and Key Performance Indicators (KPIs) generated by Redis for Tanzu Application Service component VMs.
Loggregator
Redis metrics are emitted through Loggregator through the Reverse Log Proxy and Log Cache. You can use third-party monitoring tools to consume Redis metrics to monitor Redis performance and health. The Loggregator Firehose architecture endpoint is being deprecated.
As an example of how to display KPIs and metrics without the Firehose, see the CF Redis example dashboard in GitHub. This example uses Datadog. However, VMware does not endorse or support any third-party solution.
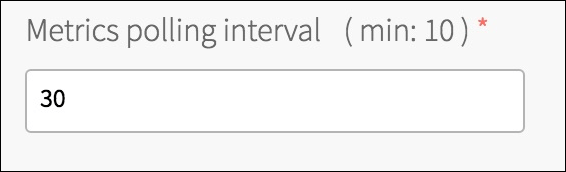
Metrics polling interval
The metrics polling interval defaults to 30 seconds. You can change this by navigating to the Metrics configuration page in Tanzu Operations Manager and entering a new value in Metrics polling interval (min: 10).
Metrics are emitted in the following format:
origin:"p-redis" eventType:ValueMetric timestamp:1480084323333475533 deployment:"cf-redis" job:"cf-redis-broker" index:"{redacted}" ip:"10.0.1.49" valueMetric:<name:"_p_redis_service_broker_shared_vm_plan_available_instances" value:4 unit:"" >
Critical logs
VMware recommends operators set up alerts on critical logs to help prevent further degradation of the Redis service. For examples of critical logs for service backups, including log messages for failed backups, backups with errors, and backups that failed to upload to destinations, see Troubleshooting in the Service Backups documentation.
Healthwatch
The Healthwatch service monitors and alerts on the current health, performance, and capacity of your service instances. By default, the Healthwatch dashboard displays core metrics and alerts configured for recommended thresholds.
For more information, see Using Healthwatch.
Key performance indicators
Key Performance Indicators (KPIs) for Redis for VMware Tanzu Application Service are metrics that operators find most useful for monitoring their Redis service to ensure smooth operation. KPIs are high-signal-value metrics that can indicate emerging issues. KPIs can be raw component metrics or derived metrics generated by applying formulas to raw metrics.
VMware recommends the following KPIs for general alerting and response with typical Redis for Tanzu Application Service installations. If using Healthwatch, some core metrics are configured by default using the recommended thresholds below. VMware recommends that operators continue to fine-tune the alert measures to their installation by observing historical trends. VMware also recommends that operators expand beyond this guidance and create new, installation-specific monitoring metrics, thresholds, and alerts based on learning from their own installations.
For how to create custom service alerts for Healthwatch, see Configuring Healthwatch alerts.
For a list of all other Redis metrics, see Other Redis metrics.
Redis for Tanzu Application Service KPIs
Total instances for on-demand service
total_instances |
|
|---|---|
| Description | Total instances provisioned by app developers across all on-demand services and for a specific on-demand plan Use: Track instance use by app developers. Origin: Doppler/Firehose Type: count Frequency: 30s (default), 10s (configurable minimum) |
| Recommended measurement | Daily |
| Recommended alert thresholds | Yellow warning: N/A Red critical: N/A |
| Recommended response | N/A |
Quota remaining for on-demand service
quota_remaining |
|
|---|---|
| Description | Number of available instances across all on-demand services and for a specific on-demand plan. Use: Track remaining resources available for app developers. Origin: Doppler/Firehose Type: count Frequency: 30s (default), 10s (configurable minimum) |
| Recommended measurement | Daily |
| Recommended alert thresholds | Yellow warning: 3 Red critical: 0 |
| Recommended response | Increase quota allowed for the specific plan or across all on-demand services. |
Total instances for shared VM service
| _p_redis_service_broker_shared_vm_plan_total_instances |
|
|---|---|
| Description | Total instances provisioned for shared-VM services. Use: Track total shared-VM instances available for app developers. Origin: Doppler/Firehose Type: count Frequency: 30s (default), 10s (configurable minimum) |
| Recommended measurement | App-specific |
| Recommended alert thresholds | Yellow warning: N/A Red critical: N/A |
| Recommended response | N/A |
Redis KPIs
The metrics in this section can be used for on-demand and shared-VM service instances. You can differentiate between these service instance metrics as follows:
-
On-demand service instances:
- Have origin
p.redis
- Have origin
-
Shared-VM service instances:
- Have origin
p-redis - Their names are pre-pended with
_p_redis_shared_vm_SHARED_INSTANCE_GUID/.SHARED-INSTANCE-GUIDcan be retrieved by runningcf service SERVICE-NAME –guid.
- Have origin
Percent of persistent disk used
disk.persistent.percent |
|
|---|---|
| Description | Percentage of persistent disk being used on a VM. The persistent disk is specified as an IaaS-specific disk type with a size. For example, pd-standard on GCP, or st1 on AWS, with disk size 5 GB. This is a metric relevant to the health of the VM. A percentage of disk usage approaching 100 causes the VM disk to become unusable as no more files are allowed to be written. Use: Redis is an in-memory datastore that uses a persistent disk to backup and restore the dataset in case of upgrades and VM restarts. Origin: BOSH HM Type: percent Frequency: 30s (default), 10s (configurable minimum) |
| Recommended measurement | Average over last 10 minutes |
| Recommended alert thresholds | Yellow warning: >75 Red critical: >90 |
| Recommended response | Ensure that the disk is at least 2.5x the VM memory for the on-demand broker and 3.5x the VM memory for cf-redis-broker. If it is, then contact VMware Tanzu Support. If it is not, then increase disk space. |
Used memory percent
info.memory.used_memory / info.memory.maxmemory |
|
|---|---|
| Description | The ratio of these two metrics returns the percentage of available memory used:
maxmemory-policy of allkeys-lru Origin: Doppler/Firehose Type: percentage Frequency: 30s (default), 10s (configurable minimum) |
| Recommended measurement | App-specific based on velocity of data flow. Some options are:
|
| Recommended alert thresholds | Yellow warning: 80% Not applicable for cache usage. When used as a cache, Redis typically uses up to maxmemory and then evict keys to make space for new entries. A different threshold might be appropriate for specific use cases of no key eviction, to account for reaction time. Factors to consider:
|
| Recommended response | No action assuming the maxmemory policy set meets your apps needs. If the maxmemory policy does not persist data as you want, either coordinate a backup cadence or update your maxmemory policy if using the on-demand Redis service. |
Connected clients
info.clients.connected_clients |
|
|---|---|
| Description | Number of clients currently connected to the Redis instance. Use: Redis does not close client connections. They remain open until closed explicitly by the client or another script. Once the connected_clients reaches maxclients, Redis stops accepting new connections and begins producing ERR max number of clients reached errors. Origin: Doppler/Firehose Type: number Frequency: 30s (default), 10s (configurable minimum) |
| Recommended measurement | Average over last 10 minutes |
| Recommended alert thresholds | Yellow warning: App-specific. When connected clients reaches max clients, no more clients can connect. This alert must be at the level where it can tell you that your app has scaled to a certain level and can require action. Red critical: App-specific. When connected clients reaches max clients, no more clients can connect. This alert must be at the level where it can tell you that your app has scaled to a certain level and can require action. |
| Recommended response | Increase max clients for your instance if using the on-demand service, or reduce the number of connected clients. |
Blocked clients
info.clients.blocked_clients |
|
|---|---|
| Description | The number of clients currently blocked waiting for a blocking request they have made to the Redis server. Redis provides two types of primitive commands to retrieve items from lists: standard and blocking. This metric concerns the blocking commands. Standard Commands The standard commands (LPOP, RPOP, RPOPLPUSH) immediately return an item from a list. If there are no items available the standard pop commands return nil. Blocking Commands The blocking commands (BLPOP, BRPOP, BRPOPLPUSH) wait for an empty list to become non-empty. The client connection is blocked until an item is added to the lists it is watching. Only the client that made the blocking request is blocked, and the Redis server continues to serve other clients. The blocking commands each take a timeout argument that is the time in seconds the server waits for a list before returning nil. A blocking command with timeout 0 waits forever. Multiple clients can be blocked waiting for the same list. For details of the blocking commands, see: https://redis.io/commands/blpop. Use: Blocking commands can be useful to avoid clients regularly polling the server for new data. This metric tells you how many clients are currently blocked due to a blocking command. Origin: Doppler/Firehose Type: number Frequency: 30s (default), 10s (configurable minimum) |
| Recommended measurement | App-specific. Change from baseline can be more significant than actual value. |
| Recommended alert thresholds | Yellow warning: The expected range of the blocked_clients metric depends on what Redis is being used for:
blocked_clients is expected to be non-zero, warnings could be based on change from baseline. A sudden rise in blocked_clients could be caused by source clients failing to provide data required by blocked clients.Red critical: There is no blocked_clients threshold critical to the function of Redis. However, a problem that is causing blocked_clients to rise might often cause a rise in connected_clients. connected_clients does have a hard upper limit and can be used to trigger alerts. |
| Recommended response | Analysis could include:
blocked_clients is more likely to suggest a problem in the network or infrastructure, or in the function of client apps, rather than a problem with the Redis service. |
Memory fragmentation ratio
info.memory.mem_fragmentation_ratio |
|
|---|---|
| Description | Ratio of the amount of memory allocated to Redis by the OS to the amount of memory that Redis is using Use: A memory fragmentation less than one shows that the memory used by Redis is higher than the OS available memory. In other packagings of Redis, large values reflect memory fragmentation. For Redis for Tanzu Application Service, the instances only run Redis, meaning that no other processes are affected by a high fragmentation ratio (e.g., 10 or 11). Origin: Doppler/Firehose Type: ratio Frequency: 30s (default), 10s (configurable minimum) |
| Recommended measurement | Average over last 10 minutes |
| Recommended alert thresholds | Yellow warning: < 1. Less than 1 indicates that the memory used by Redis is higher than the OS available memory which can lead to performance degradations. Red critical: Same as warning threshold. |
| Recommended response | Restart the Redis server to normalize fragmentation ratio. |
Instantaneous operations per second
info.stats.instantaneous_ops_per_sec |
|
|---|---|
| Description | The number of commands processed per second by the Redis server. The instantaneous_ops_per_sec is calculated as the mean of the recent samples taken by the server. The number of recent samples is hardcoded as 16 in the implementation of Redis. Use: The higher the commands processed per second, the better the performance of Redis. This is because Redis is single threaded and the commands are processed in sequence. A higher throughput would thus mean faster response per request which is a direct indicator of higher performance. A drop in the number of commands processed per second as compared to historical norms could be a sign of either low command volume or slow commands blocking the system. Low command volume could be normal, or it could be indicative of problems upstream. Origin: Doppler/Firehose Type: count Frequency: 30s (default), 10s (configurable minimum) |
| Recommended measurement | Every 30 seconds |
| Recommended alert thresholds | Yellow warning: A drop in the count compared to historical norms could be a sign of either low command volume or slow commands blocking the system. Low command volume could be normal, or it could be indicative of problems upstream. Slow commands could be due to a latency issue, a large number of clients being connected to the same instance, memory being swapped out, etc. Thus, the count is possibly a symptom of compromised Redis performance. However, this is not the case when low command volume is expected. Red critical: A very low count or a large drop from previous counts might indicate a downturn in performance that should result in an investigation. That is unless the low traffic is expected behavior. |
| Recommended response | A drop in the count can be a symptom of compromised Redis performance. The following are possible responses:
|
Keyspace hits / keyspace misses + keyspace hits
info.stats.keyspace_hits / info.stats.keyspace_misses + info.stats.keyspace_hits |
|
|---|---|
| Description | Hit ratio to determine share of keyspace hits that are successful Use: A small hit ratio (less than 60%) indicates that many lookup requests are not found in the Redis cache and apps are being forced to revert to slower resources. This might indicate that cached values are expiring too quickly or that a Redis instance has insufficient memory allocation and is deleting volatile keys. Origin: Doppler/Firehose Type: ratio Frequency: 30s (default), 10s (configurable minimum) |
| Recommended measurement | App-specific |
| Recommended alert thresholds | Yellow warning: App-specific. In general depending how an app is using the cache, an expected hit ratio value can vary between 60% to 99% . Also, the same hit ratio values can mean different things for different apps. Every time an app gets a cache miss, it will probably go to and fetch the data from a slower resource. This cache miss cost can be different per app. The app developers might be able to provide a threshold that is meaningful for the app and its performance Red critical: App-specific. See the warning threshold above. |
| Recommended response | App-specific. See the warning threshold above. Work with app developers to understand the performance and cache configuration required for their apps. |
BOSH Health Monitor metrics
The BOSH layer that underlies Tanzu Operations Manager generates healthmonitor metrics for all VMs in the deployment. As of Tanzu Operations Manager v2.0, these metrics are in the Loggregator Firehose by default. For more information, see BOSH System Metrics Available in Loggregator Firehose in VMware Tanzu Application Service for VMs Release Notes.
Other Redis metrics
Redis also exposes the following metrics. for more information, see the Redis documentation.
arch_bitsuptime_in_secondsuptime_in_dayshzlru_clockclient_longest_output_listclient_biggest_input_bufused_memory_rssused_memory_peakused_memory_lualoadingrdb_bgsave_in_progressrdb_last_save_timerdb_last_bgsave_time_secrdb_current_bgsave_time_secaof_rewrite_in_progressaof_rewrite_scheduledaof_last_rewrite_time_secaof_current_rewrite_time_sectotal_connections_receivedtotal_commands_processedinstantaneous_ops_per_sectotal_net_input_bytestotal_net_output_bytesinstantaneous_input_kbpsinstantaneous_output_kbpsrejected_connectionssync_fullsync_partial_oksync_partial_errexpired_keysevicted_keyskeyspace_hitskeyspace_missespubsub_channelspubsub_patternslatest_fork_usecmigrate_cached_socketsrepl_backlog_activerepl_backlog_sizerepl_backlog_first_byte_offsetrepl_backlog_histlenused_cpu_sysused_cpu_userused_cpu_sys_childrenused_cpu_user_childrenrdb_last_bgsave_statusaof_last_bgrewrite_statusaof_last_write_status
