You can configure the Spring Cloud Gateway options by visiting the Tanzu Operations Manager installation dashboard, clicking the Spring Cloud Gateway tile, and then going to the Service Broker pane.
Configuring service access
By default, the Spring Cloud Gateway service is made available globally (that is, to all orgs). You can configure the service availability in the Spring Cloud Gateway tile settings, under Gateway Service access.

Select Global to make the Spring Cloud Gateway service available to all orgs, or select None to make the Spring Cloud Gateway service unavailable to all orgs.
Setting the buildpack for service instances
By default, the Spring Cloud Gateway service broker stages service instance backing apps using the buildpack chosen by the platform's buildpack detection; normally, this will be the highest-priority Java buildpack. To cause the broker to use a particular Java buildpack regardless of priority, you can change the name of the buildpack to use in the Spring Cloud Gateway tile settings, under Java Buildpack.
Enter the name of the desired Java buildpack. The broker will use the selected buildpack to stage service instance backing apps.

Setting the stack for service instances
By default, the Spring Cloud Gateway service broker stages service instance backing apps using the platform's default stack. To cause the broker to use a particular stack regardless of the default, you can change the name of the stack to use in the Spring Cloud Gateway tile settings, under Stack.
Enter the name of the desired stack. The broker will use the selected stack for all new service instance backing apps. To upgrade existing backing apps to the newly selected stack, run the upgrade-all-instances errand.

Setting the service instance timeout
By default, the Spring Cloud Gateway service broker will wait 30 minutes before considering a service instance operation to have failed. You can specify a different timeout interval in the Spring Cloud Gateway tile settings, under Status change timeout.
Enter the desired number of minutes. The broker will allow the specified number of minutes for service instance operations to complete. The minimum allowed is 1 minute.

Setting a custom domain for service instances
By default, the Spring Cloud Gateway service broker assigns routes to service instances using the platform's application domain. You can specify a custom domain for service instance routes in the Spring Cloud Gateway tile settings, under Service instances domain.
Enter the desired domain. The broker will use this domain to create routes for service instances.
Important Your custom domain must be available to the p-spring-cloud-gateway-service org. If you are installing Spring Cloud Gateway, you must manually create this org before configuring the custom domain in the Spring Cloud Gateway tile settings.

Configuring observability for service instances
Spring Cloud Gateway can be configured to expose tracing and to generate a set of metrics and tracings based on different monitoring signals to help with understanding behavior in aggregate.
Note Metrics and tracing are independent from each other.
Exposing metrics to Wavefront
To expose metrics to Wavefront we need to select the check box Enable Metrics with Wavefront, and provide a Wavefront API token and a URI endpoint.
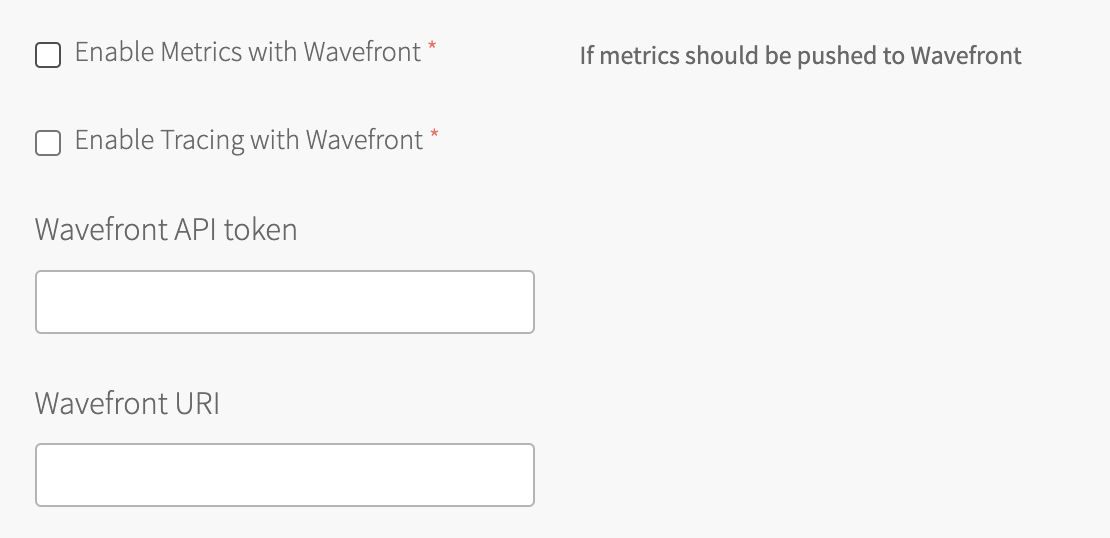
After applying the configuration, Wavefront will start receiving the metrics provided by default by Spring Cloud Gateway.
Using the Spring Cloud gateway dashboard for Wavefront
Spring Cloud Gateway has a pre-built dashboard you can use in Wavefront.
If you are using VMware Wavefront, then you can clone and customize the already created Spring Cloud Gateway Dashboard.
Alternatively, the Spring Cloud Gateway release artifacts contain a dashboard you can find inside the dashboards release folder.
To import it, create an API Token and execute the following command:
curl -XPOST 'https://vmware.wavefront.com/api/v2/dashboard' --header "Authorization: Bearer ${WAVEFRONT_API_TOKEN}" --header "Content-Type: application/json" -d "@wavefront-spring-cloud-gateway-for-tas.json"
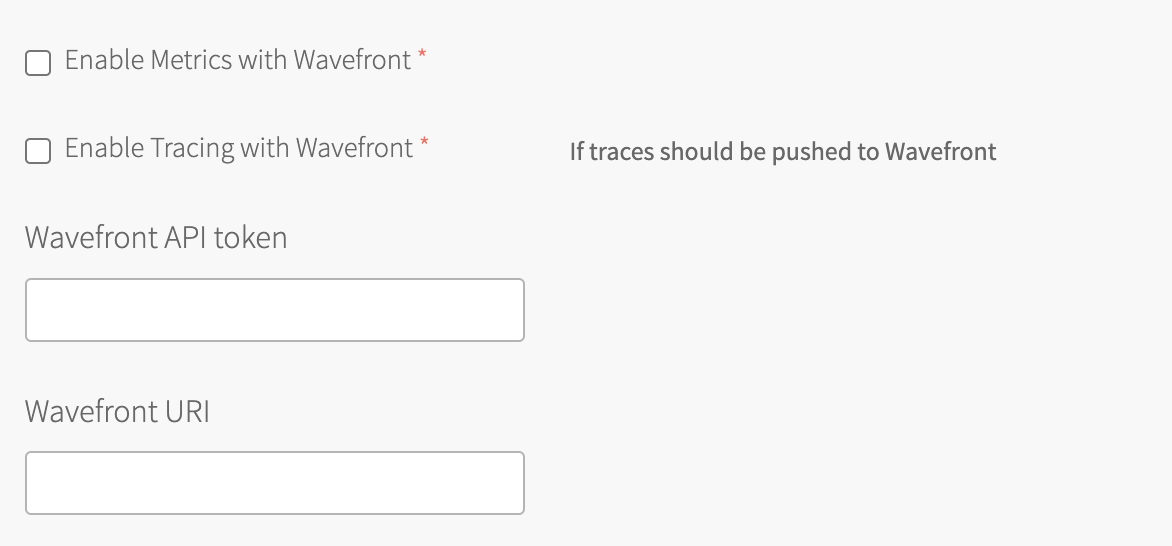
Exposing tracing to Wavefront
To expose tracing to Wavefront, select the Enable Tracing with Wavefront check box, and provide a Wavefront API token and a URI endpoint.
After applying the configuration, Wavefront starts receiving the traces.
Configuring Redis
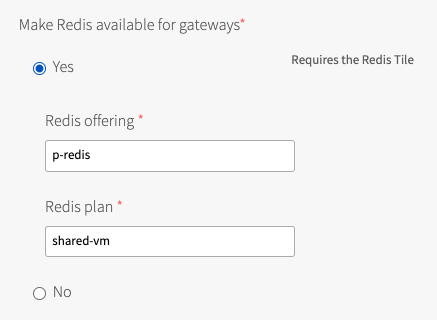
Redis can be made available as the implementation technology for session management and rate limiting. This requires the Redis tile to be installed. When a developer opts in to Redis while creating a gateway instance, the service broker will automatically create a Redis instance and bind it to the gateway.
To configure Redis, go to the Service Broker section. Under Make Redis available for gateways, select Yes. Then provide the Redis offering (for example, p-redis) and Redis plan (for example, shared-vm).
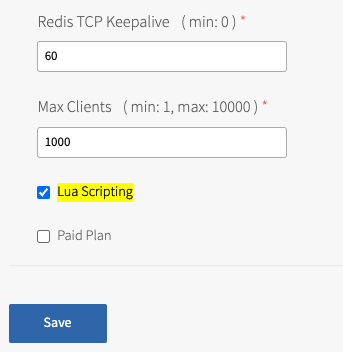
Important Lua Scripting must be activated on the Redis tile configuration. Otherwise, the Rate Limit feature will fail.
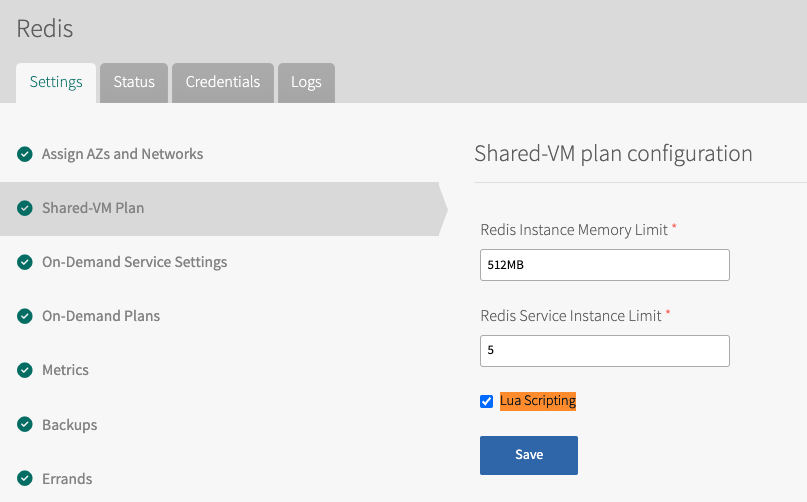
Activating Lua scripting on the Redis tile
To activate Lua Scripting on the Shared-VM Plan, go to the Shared-VM Plan section and select Lua Scripting.
To activate Lua Scripting on your on-demand plans, go the On-Demand Plans section, and for each added plan, select Lua Scripting.