Unified Access Gateway provides information on active sessions of each edge service. You can quickly see that services you deployed are configured, up and running successfully from the admin UI for each Edge Service.
Procedure
- Navigate to Support Settings > Edge Service Session Statistics.
- In the Support Settings section, click the Edge Service Session Statistics gearbox icon.
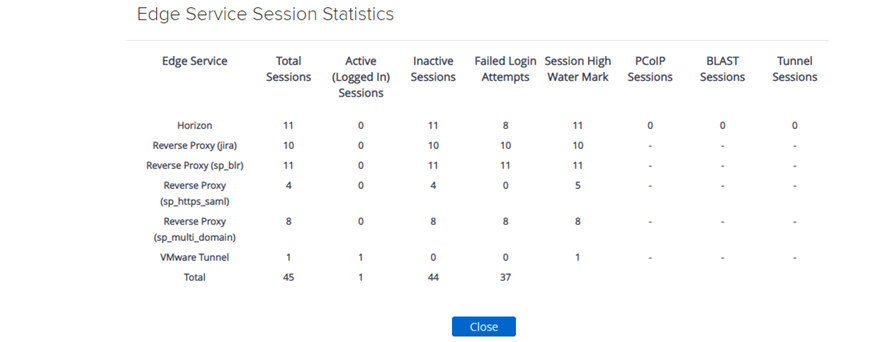
Figure 1. Edge Service Session Statistics 
- Edge Service lists the specific edge service for which the session statistics are displayed.
- Total Sessions indicate the sum of active and inactive sessions.
- Active Sessions (Logged in Sessions) indicate the number of ongoing authenticated sessions.
Note: When Horizon sessions are launched from Horizon Universal Broker, the count for these sessions is not included in this number.
- Inactive Sessions indicate the number of unauthenticated sessions.
- Failed Login Attempts indicate the number of failed login attempts.
- Session High Water Mark indicate the maximum number of concurrent sessions at a given point in time.
- PCoIP Sessions indicate the number of sessions established with PCoIP.
- BLAST Sessions indicate the number of sessions established with Blast.
- Tunnel Sessions indicate the number of sessions established with Horizon Tunnel.
Table 1. Example of Edge Service Session Statistics Edge Service Total Sessions Active (Logged In) Sessions Inactive Sessions Failed Login Attempts Session High Water Mark PCoIP Sessions BLAST Sessions Tunnel Sessions Horizon 11 0 11 8 11 0 0 0 Reverse Proxy (jira) 10 0 10 10 10 - - - Reverse Proxy (sp_blr) 11 0 11 11 11 - - - Reverse Proxy (sp_https_saml) 4 0 4 0 5 - - - Reverse Proxy (sp_multi_domain) 8 0 8 8 8 - - - VMware Tunnel 1 1 0 0 1 - - - Total 45 1 44 37 - - -