You can use the SEG V2 Admin page to monitor the health and diagnostics of your SEG.
The following procedure describes the steps to view the SEG health and diagnostics information.
- Navigate to the .
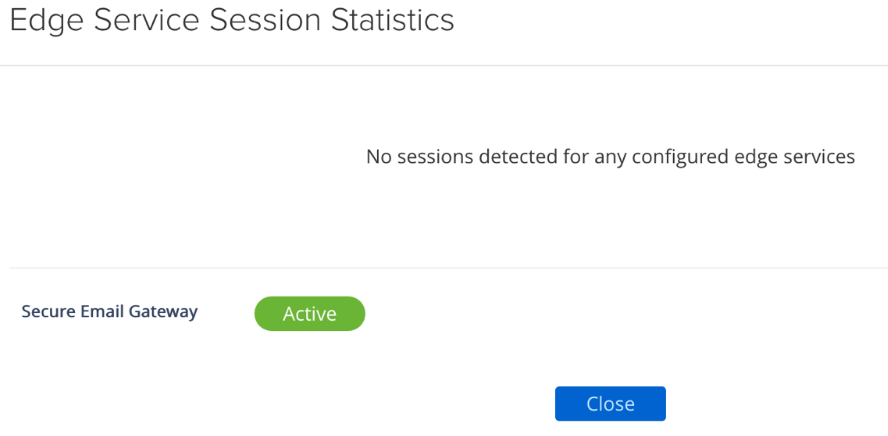
- Click the Edge Service Session Statistics gearbox icon, in the Support Settings section. If SEG is enabled, the following screen appears.

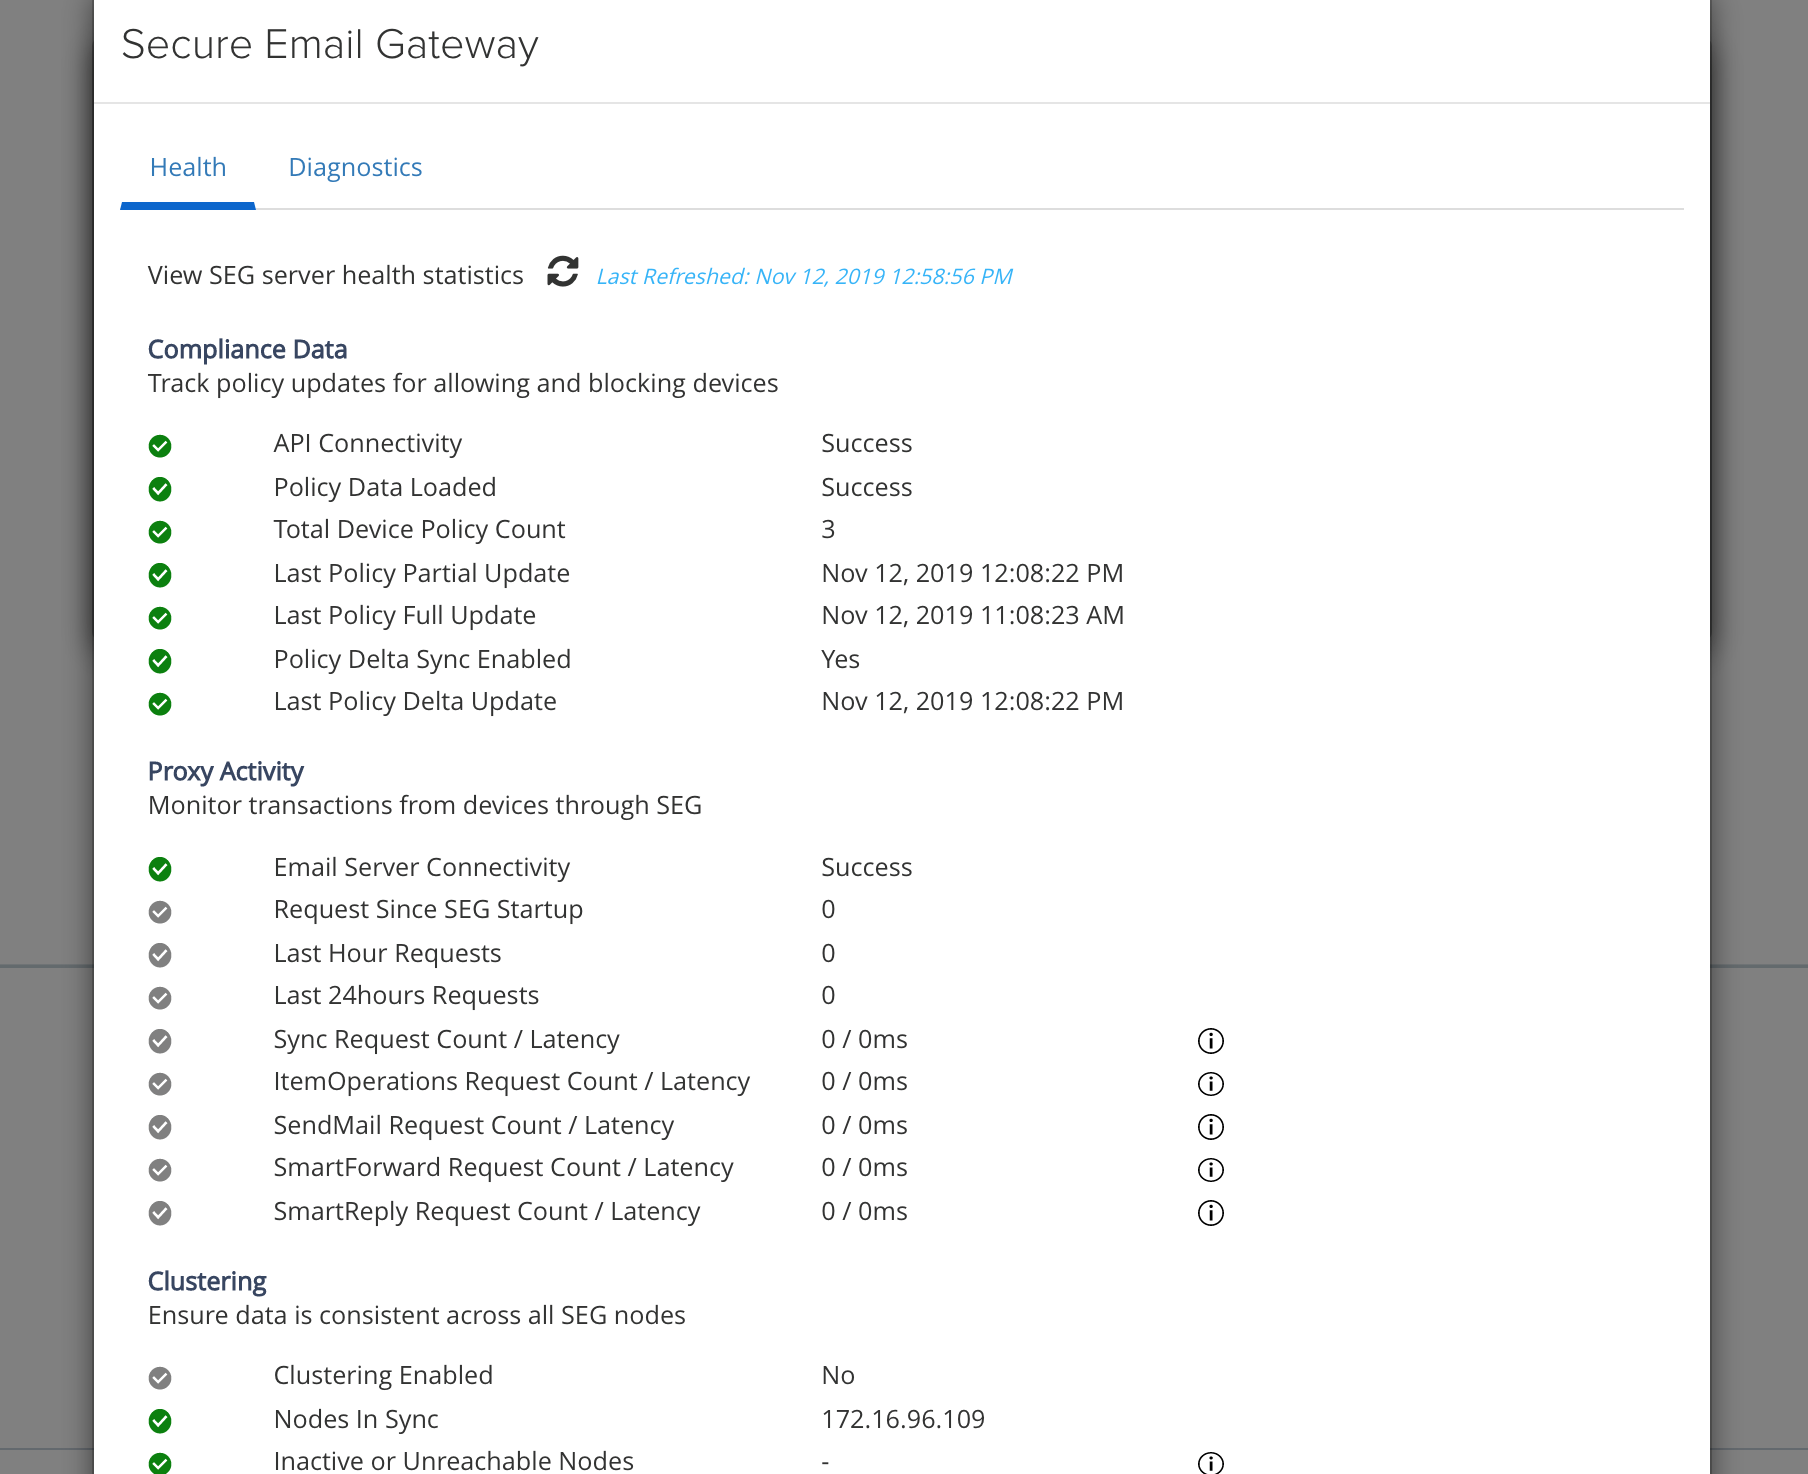
- Click Active to open the SEG Health and Diagnostics monitoring screen. The following screen appears.

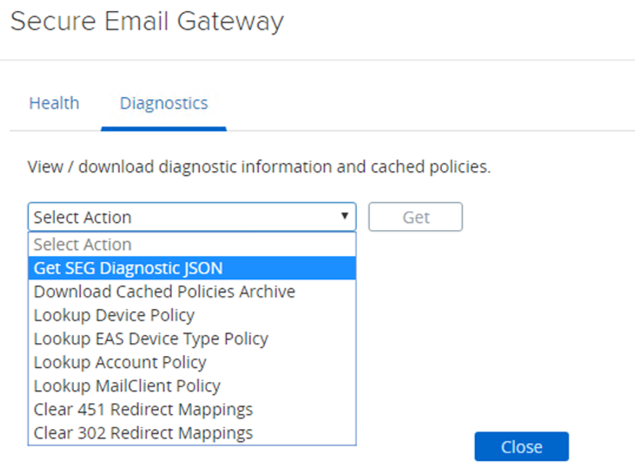
The SEG diagnostics screen provides the following options to the user:
- View or download the SEG diagnostic JSON.
- Look up the specific policy from the SEG cache.
- Archive and download the SEG cached policies, redirect mappings, and diagnostic information.
- Clear redirect mappings from the SEG cache.
The following image shows the Diagnostics screen for SEG.

SEG Diagnostic APIs
The following table describes the API path and parameters for accessing the SEG diagnostics information.
SEG Diagnostics URL: GET https://<UAGIP>:9443/rest/v1/monitor/seg/diagnostics/<apiPath>.
| API Path | Description |
|---|---|
| Diagnostic | View the SEG diagnostic JSON. |
| policy/device/<easDeviceId> | Look up the device policy for a given EAS device ID. |
| policy/account/<accountId> | Look up the policy for a given user or group using the account ID. |
| policy/easdevicetype/<easdevicetype> | Look up the policy for a given EAS device type. |
| policy/mailclient/<mailclientname> | Look up the policy for a given mail client. |
| cache/archive | Archive and download the SEG cached policies, redirect mappings, and diagnostic information. |
| policy/account/<accountId> | Look up the device policy for a given EAS device ID. |
The following table lists the APIs for clearing the redirect mappings from the SEG cache.
Clear Redirect Cache Mappings URL: DELETE https://<UAGIP>:9443/rest/v1/monitor/seg/cache/<parameter>
| Parameter | Description |
|---|---|
| 451 | Clear 451 redirect mappings from the SEG cache. |
| 302 | Clear 302 redirect mappings from the SEG cache. |
SEG Health APIs
The following table describes the SEG health statistic response attributes.
SEG Health URL: GET https://<UAGIP>:9443/rest/v1/monitor/seg/healthStats
| Response Attribute | Description |
|---|---|
| diagnosticExportTime | Specify the time of generation of the statistics, in milliseconds, since the UNIX epoch time. |
| apiConnectivity | Status of connectivity from the SEG to the API server. The status value can be Success or Failed. |
| policyDataLoaded | Status of the policy data loading into the SEG cache. The status value can be Success, In Progress, or Failed. |
| totalDevicePolicyCount | Specify the count of the device policies loaded into the SEG cache. |
| lastPolicyPartialUpdate | Specify the time of the latest successful partial policy update execution, in milliseconds, since the UNIX epoch time. |
| lastPolicyFullUpdate | Specify the time of the latest successful policy update execution, in milliseconds, since the UNIX epoch time. |
| lastPolicyDeltaUpdate | Specify the time of the latest delta policy update execution, in milliseconds, since the UNIX epoch time. |
| policyDeltaSyncEnabled | Flag to indicate if the policy delta sync is enabled. |
| emailServerConnectivity | Status of connectivity from the SEG to the API server. The attribute values can be Success or Failed. |
| requestsSinceSEGstartup | Number of ActiveSync requests since the SEG server was launched. |
| lastHourRequests | Number of ActiveSync requests in the last one hour. |
| last24hourRequests | Number of ActiveSync requests in the last 24 hours. |
syncStat
|
Specify the corresponding statistics to the Sync requests.
|
itemOperationsStat
|
Specify the corresponding statistics to the itemOperations requests.
|
sendMailStat
|
Specify the corresponding statistics to the sendMail requests.
|
smartForwardStat
|
Specify the corresponding statistics to the smartForward requests.
|
smartReplyStat
|
Specify the corresponding statistics to the smartReply requests.
|
| clusteringEnabled | Flag to indicate if the clustering is enabled. |
| nodesOnline | List of nodes that are active in the cluster. |
| nodesOffline | List of nodes that are listed in the MEM configuration, but not active in the cluster. |
| nodesSynchronized | Flag to indicate if all the nodes in the cluster are in synchronization. |