As a workflow designer, you can debug individual schema elements.
Procedure
- Log in to the Automation Orchestrator Client.
- Navigate to Library > Workflows, and select your workflow.
- Select the Schema tab.
- Select the workflow element you want to debug, and click the debug button on the top-left of the element.
Note: By adding a breakpoint to a Workflow Element schema element, you can debug child workflows directly from the parent workflow. When the debugger reaches the Workflow Element schema element, it opens the schema view of the child workflow.
- Repeat for any other schema elements you want to debug.
- Click Debug.
- Enter the requested input parameter values, and click Run.
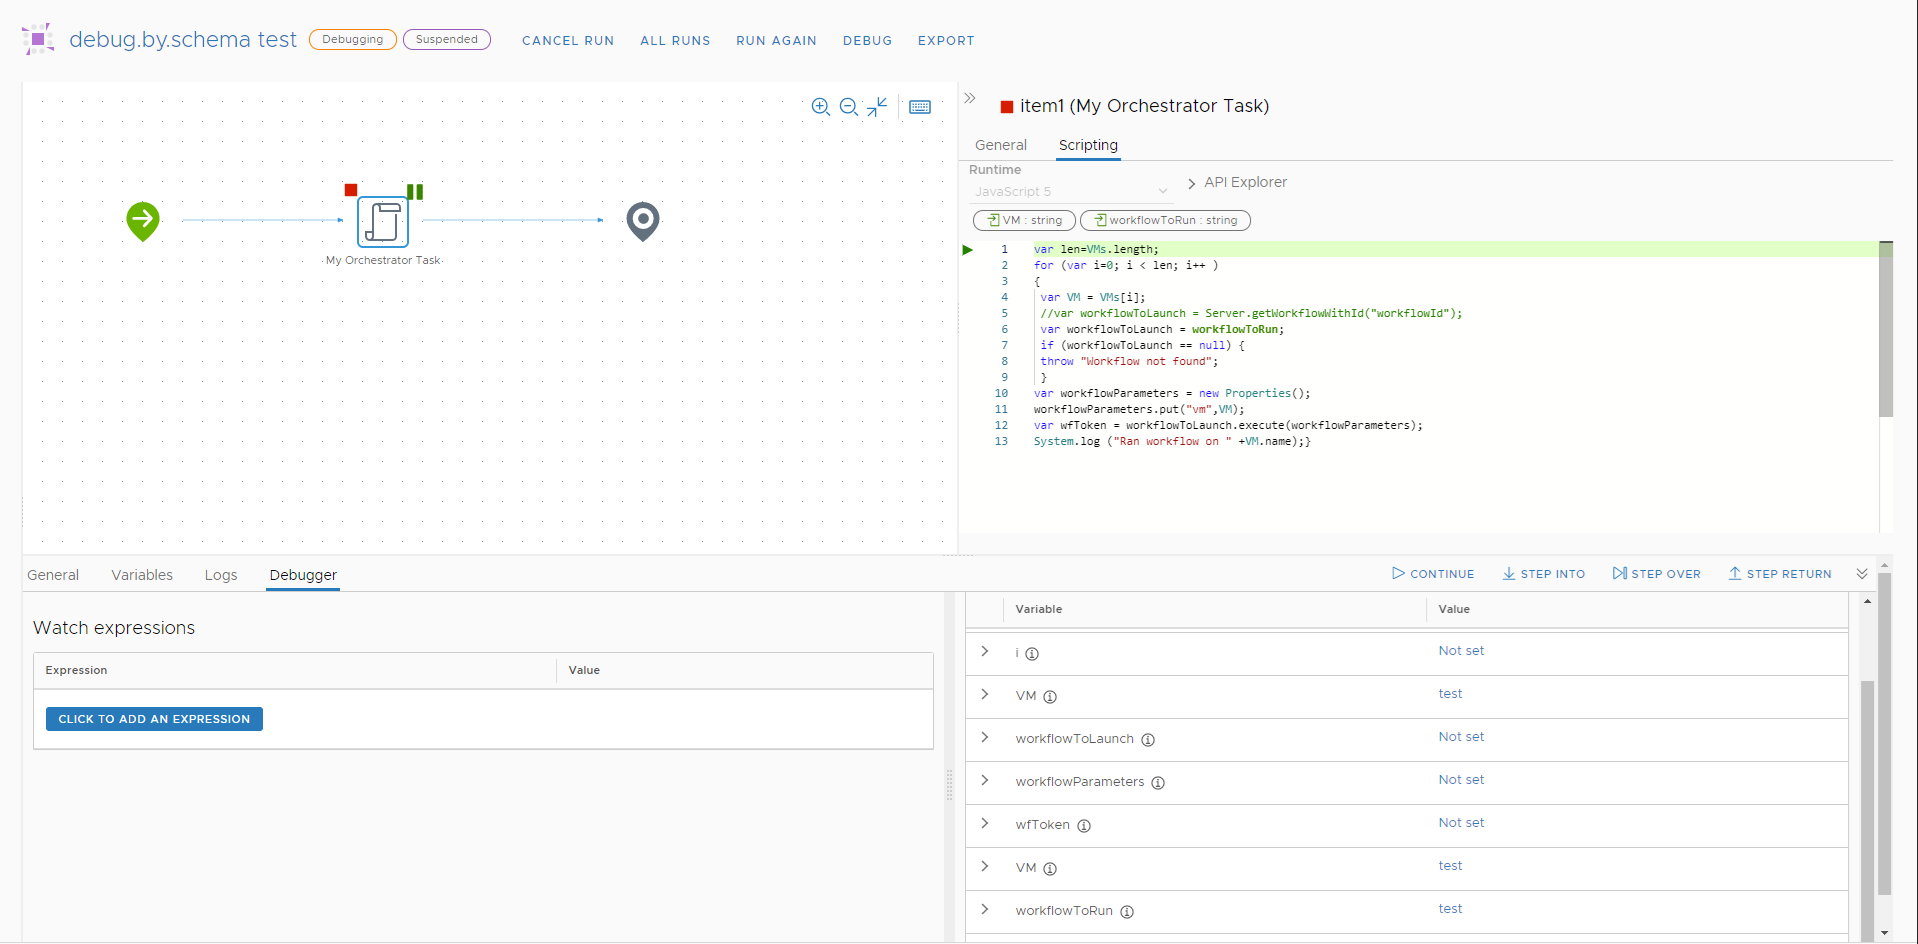
The workflow run begins, and is suspended when the debugger reaches a schema element with a breakpoint.
- When at a breakpoint, select one of the following options:
Option Description Continue Resumes the workflow run until another breakpoint is reached or the workflow run finishes. Step into Step into the current workflow function. If the debugger cannot go deeper into the current line of the function, it performs a Step over operation. Step over The debugger continues into the next line of the current function. Step return The debugger goes into the line that will perform when the current function returns. - (Optional) On the Variables tab, edit the value of your workflow variables.