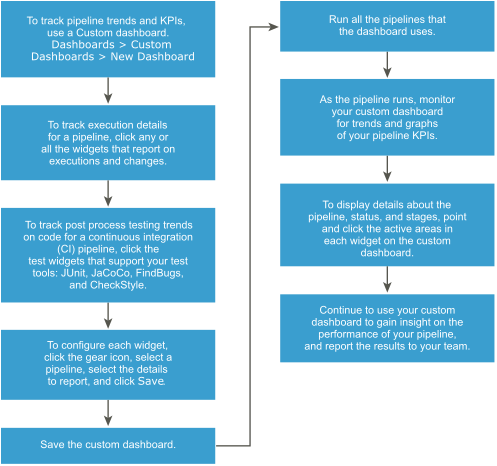
As a Automation Pipelines administrator of developer, you create the custom dashboard to display the results you want to see for one or more pipelines that ran. For example, you can create a project-wide dashboard with KPIs and metrics gathered from multiple pipelines. If an execution warning or failure is reported, you can use the dashboard to troubleshoot the failure.
To track trends and key performance indicators for your pipelines by using a custom dashboard, you add widgets to the dashboard, and configure them to report on your pipelines.

Prerequisites
- Verify that one or more pipelines exist. In the user interface, click Pipelines.
- For the pipelines that you intend to monitor, verify that they ran successfully. Click Executions.
Procedure
- To create a custom dashboard, click .
- To customize the dashboard so that it reports on specific trends and key performance indicators for your pipeline, click a widget.
For example, to display details about the pipeline status, stages, tasks, how long it ran, and who ran it, click the
Execution Details widget. Or, for a continuous integration (CI) pipeline, you can track the trends on post-processing by using the widgets for JUnit, JaCoCo, FindBugs, and CheckStyle.
- Configure each widget that you add.
- On the widget, click the gear icon.
- Select a pipeline, set the available options, and select the columns to display.
- To save the widget configuration, click Save.
- To save the custom dashboard, click Save, and click Close.
- To display more information about the pipeline, click the active areas on the widgets.
For example, in the
Execution Details widget, click an entry in the Status column to display more information about the pipeline execution. Or, on the
Latest Successful Change widget, to display a summary of the pipeline stage and task, click the active link.
Results
Congratulations! You created a custom dashboard that monitors trends and KPIs for your pipelines.
What to do next
Continue to monitor the performance of your pipelines in Automation Pipelines, and share the results with your manager and teams to continue to improve the process to release your applications.

