


After creating a CloudHealth integration, you can view the pricing and cost information for public cloud deployments in Automation Assembler.
Before you can view pricing for AWS and Azure in Automation Assembler, you must have an existing CloudHealth integration endpoint. You can create a CloudHealth integration on the page.
If you have both private cloud and public cloud pricing enabled with a VMware Aria Automation and VMware Aria Operations integration and a CloudHealth integration, you must align the currencies across CloudHealth and VMware Aria Operations to view an accurate price aggregation in Automation Assembler. If the currencies are not aligned, Automation Assembler only shows private cloud prices aggregated as a project price.
CloudHealth organizes assets into perspective groups. Using these groups, you can generate current and historical price reports for public cloud deployments. By default, the perspective syncs deployments every 12 hours between CloudHealth and VMware Aria Automation. After being synced, CloudHealth generates a cost for all perspective groups.
If a new deployment is provisioned by VMware Aria Automation, the associated costs are synced 12 hours later when the perspective is synced.
You can manually generate prices from CloudHealth by clicking . Prices are generated at a deployment level only. Resource level prices for public cloud deployments is not supported.
Currently, Automation Assembler does not support pricing for GCP deployments.
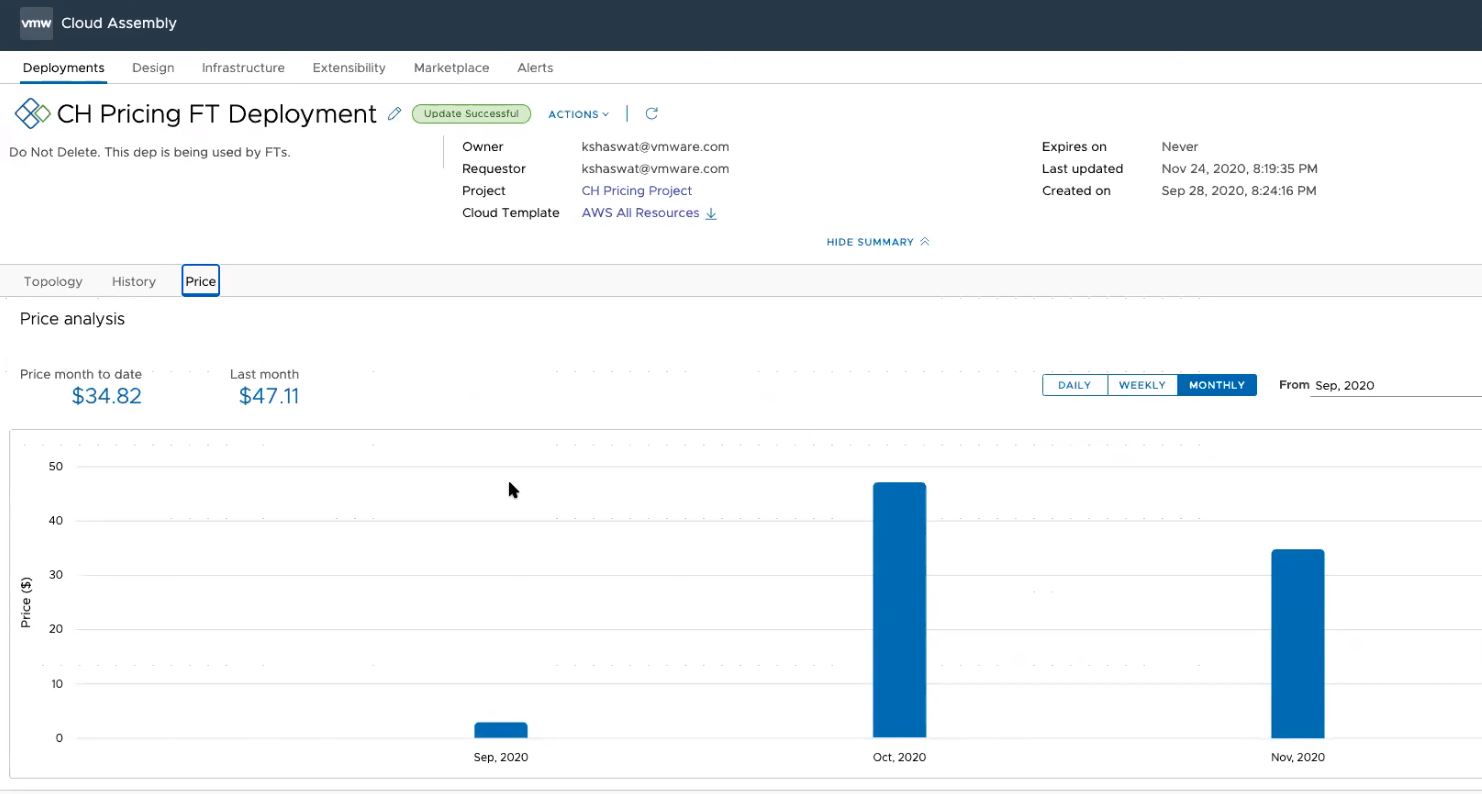
Prices are synced every 6 hours. You can view the price history in Automation Assembler by navigating to your AWS or Azure deployment and clicking Price. The price analysis provides an overview and detailed view of the deployment price along with the price month-to-date value. You can change the graphical representation to display the deployment price as daily, weekly, or monthly values. Also, you can specify an exact date range or month for the price history.
You can also view the cost history for public cloud deployments directly in CloudHealth by selecting the deployment type, clicking Cost and selecting Current or History. The cost analysis provides an overview of perspective groups and their associated costs that you can filter and sort by length of time.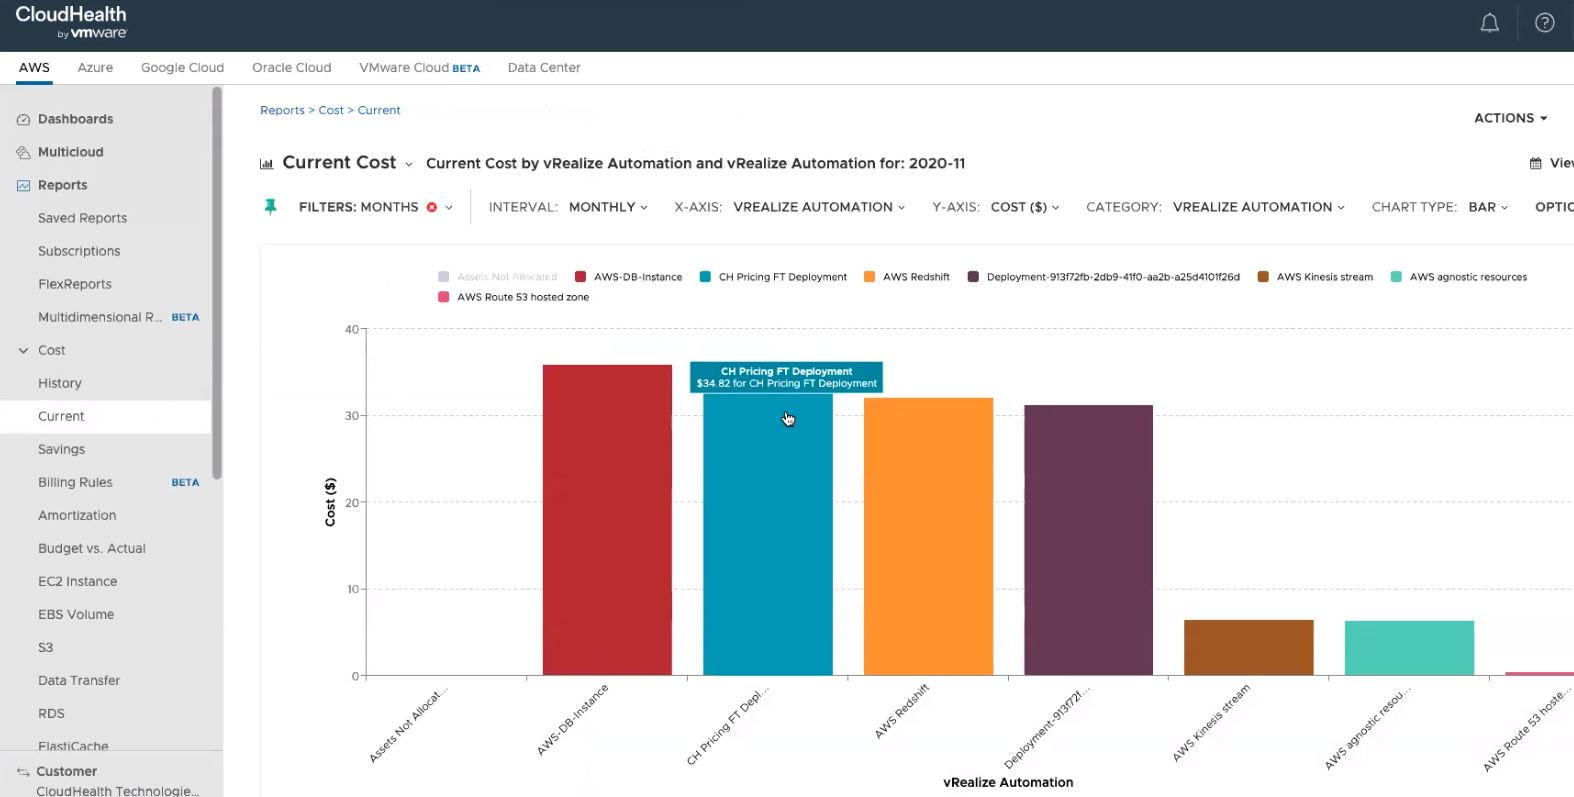
Prices are determined by these costed components types.
| AWS | Azure |
|---|---|
| Cloud.AWS.EC2.Instance | Cloud.Azure.Machine |
| Cloud.AWS.Volume | Clould.Azure.Disk |
| Cloud.Service.AWS.S3.Bucket | Cloud.Service.Azure.SQL.Database |
| Cloud.Service.AWS.RDS.Cluster.Instance | Cloud.Service.Azure.Storage.Account |
| Cloud.Service.AWS.DB.Instance | Cloud.Service.Azure.SQL.Server |
| Cloud.Service.AWS.EMR.Cluster | Cloud.Service.Azure.App.Service.Plan |
| Cloud.Service.AWS.Kinesis.Firehose.Delivery.Stream | Cloud.Service.Azure.App.Service.Slot |
| Cloud.Service.AWS.Kinesis.Stream | Cloud.Service.Azure.Search.Service |
| Cloud.Service.AWS.KMS.Key | Cloud.Service.Azure.Key.Vault |
| Cloud.Service.AWS.Lambda.Function | Cloud.Service.Azure.Redis.Cache |
| Cloud.Service.AWS.Redshift.Cluster | Cloud.Service.Azure.App.Service |
| Cloud.Service.AWS.Route53.Zone | |
| Cloud Agnostic Resource Types | |
| Cloud.LoadBalancer | Cloud.Machine |
| Cloud.Machine | Cloud.Volume |
| Cloud.Volume | |
