A pipeline dashboard is a view of the results for a specific pipeline that ran, such as trends, top failures, and successful changes. Automation Pipelines creates the pipeline dashboard when you create a pipeline.
The dashboard contains the widgets that display pipeline execution results.
Pipeline Execution Status Counts Widget
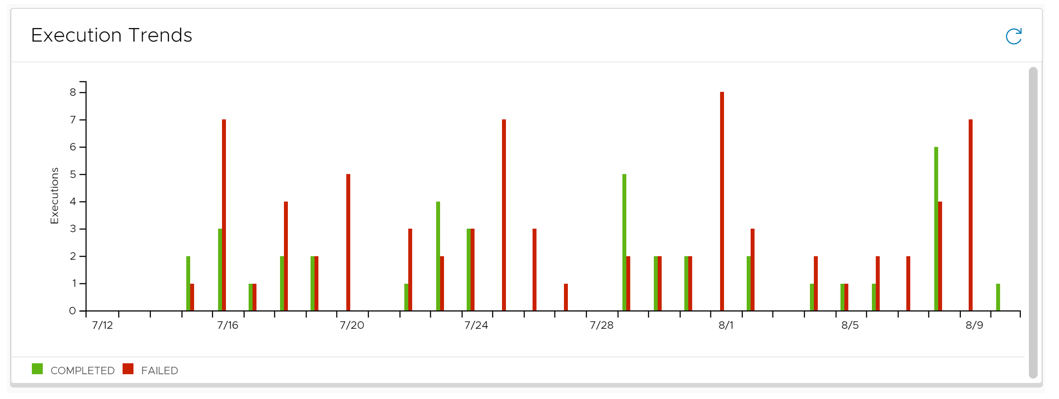
You can view the total number of executions of a pipeline over a period of time grouped by status: Completed, Failed, or Canceled. To see how the pipeline execution status has changed over longer or shorter periods of time, change the duration on the display.
Pipeline Execution Statistics Widget
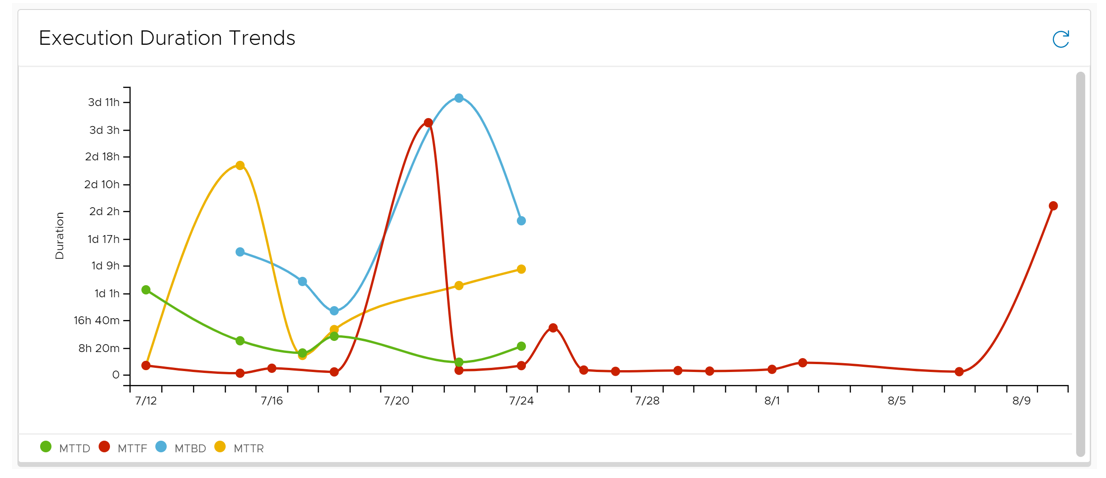
The pipeline execution statitstics include the mean times to recover, deliver, or fail a pipeline over time.
- Completed
- Failed
- Waiting
- Running
- Canceled
- Queued
- Not Started
- Rolling Back
- Rollback Completed
- Rollback Failed
- Paused
| What gets measured... | What it means... |
|---|---|
| Average CI | Average time spent in the continuous integration phase, measured by time in the CI task type. |
| Mean time to delivery (MTTD) | Average duration of all COMPLETED runs over a period of time. D1, D2, and so forth is the amount of time to deliver each COMPLETED run.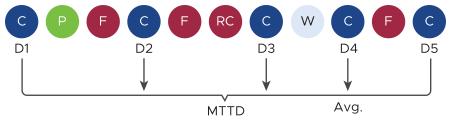 |
| Mean time between deliveries (MTBD) | Average time elapsed between successful deliveries over a period of time. The time elapsed between two consecutive COMPLETED runs is the time between successful deliveries, such as BD1, BD2 and so forth. MTBD indicates how often a production environment updates. 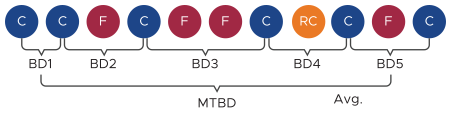 |
| Mean time to failure (MTTF) | Average duration of runs that end in FAILED, ROLLBACK_COMPLETED or ROLLBACK_FAILED states over a period of time. F1, F2, and so forth is the amount of time for a run to end in FAILURE, ROLLBACK_COMPLETED, or ROLLBACK FAILED.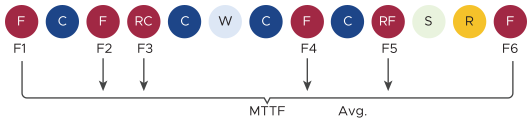 |
| Mean time to recovery (MTTR) | Average time to recovery from a failure over a period of time. The time to recovery from a failure is the time elapsed between a run with a final status of FAILED, ROLLBACK_COMPLETED, or ROLLBACK_FAILED and the next immediate successful run with a COMPLETED status. R1, R2 and so forth, is the amount of time to recovery after each FAILED or ROLLBACK_FAILED run. 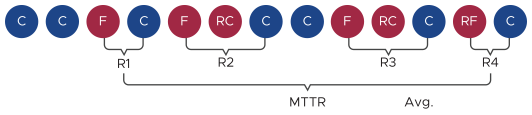 |
Top Failed Stages and Tasks Widgets
Two widgets display the top failed stages and tasks in a pipeline. Each measurement reports the number and percentage of failures for development and post-development environments for each pipeline and project, averaged over a week or month. You view the top failures to troubleshoot problems in the release automation process.
For example, you can configure the display for a particular duration such as the last seven days and note the top failed tasks during that period of time. If you make a change in your environment or pipeline and run the pipeline again, then check the top failed tasks over a longer duration such as the last 14 days, the top failed tasks may have changed. With that result, you will know that the change in your release automation process improved the success rate of your pipeline execution.
Pipeline Execution Duration Trends Widget
Pipeline Execution Trends Widget