


The Management Pack for VMware Aria Operations for Applications provides four out-of-the-box dashboards.
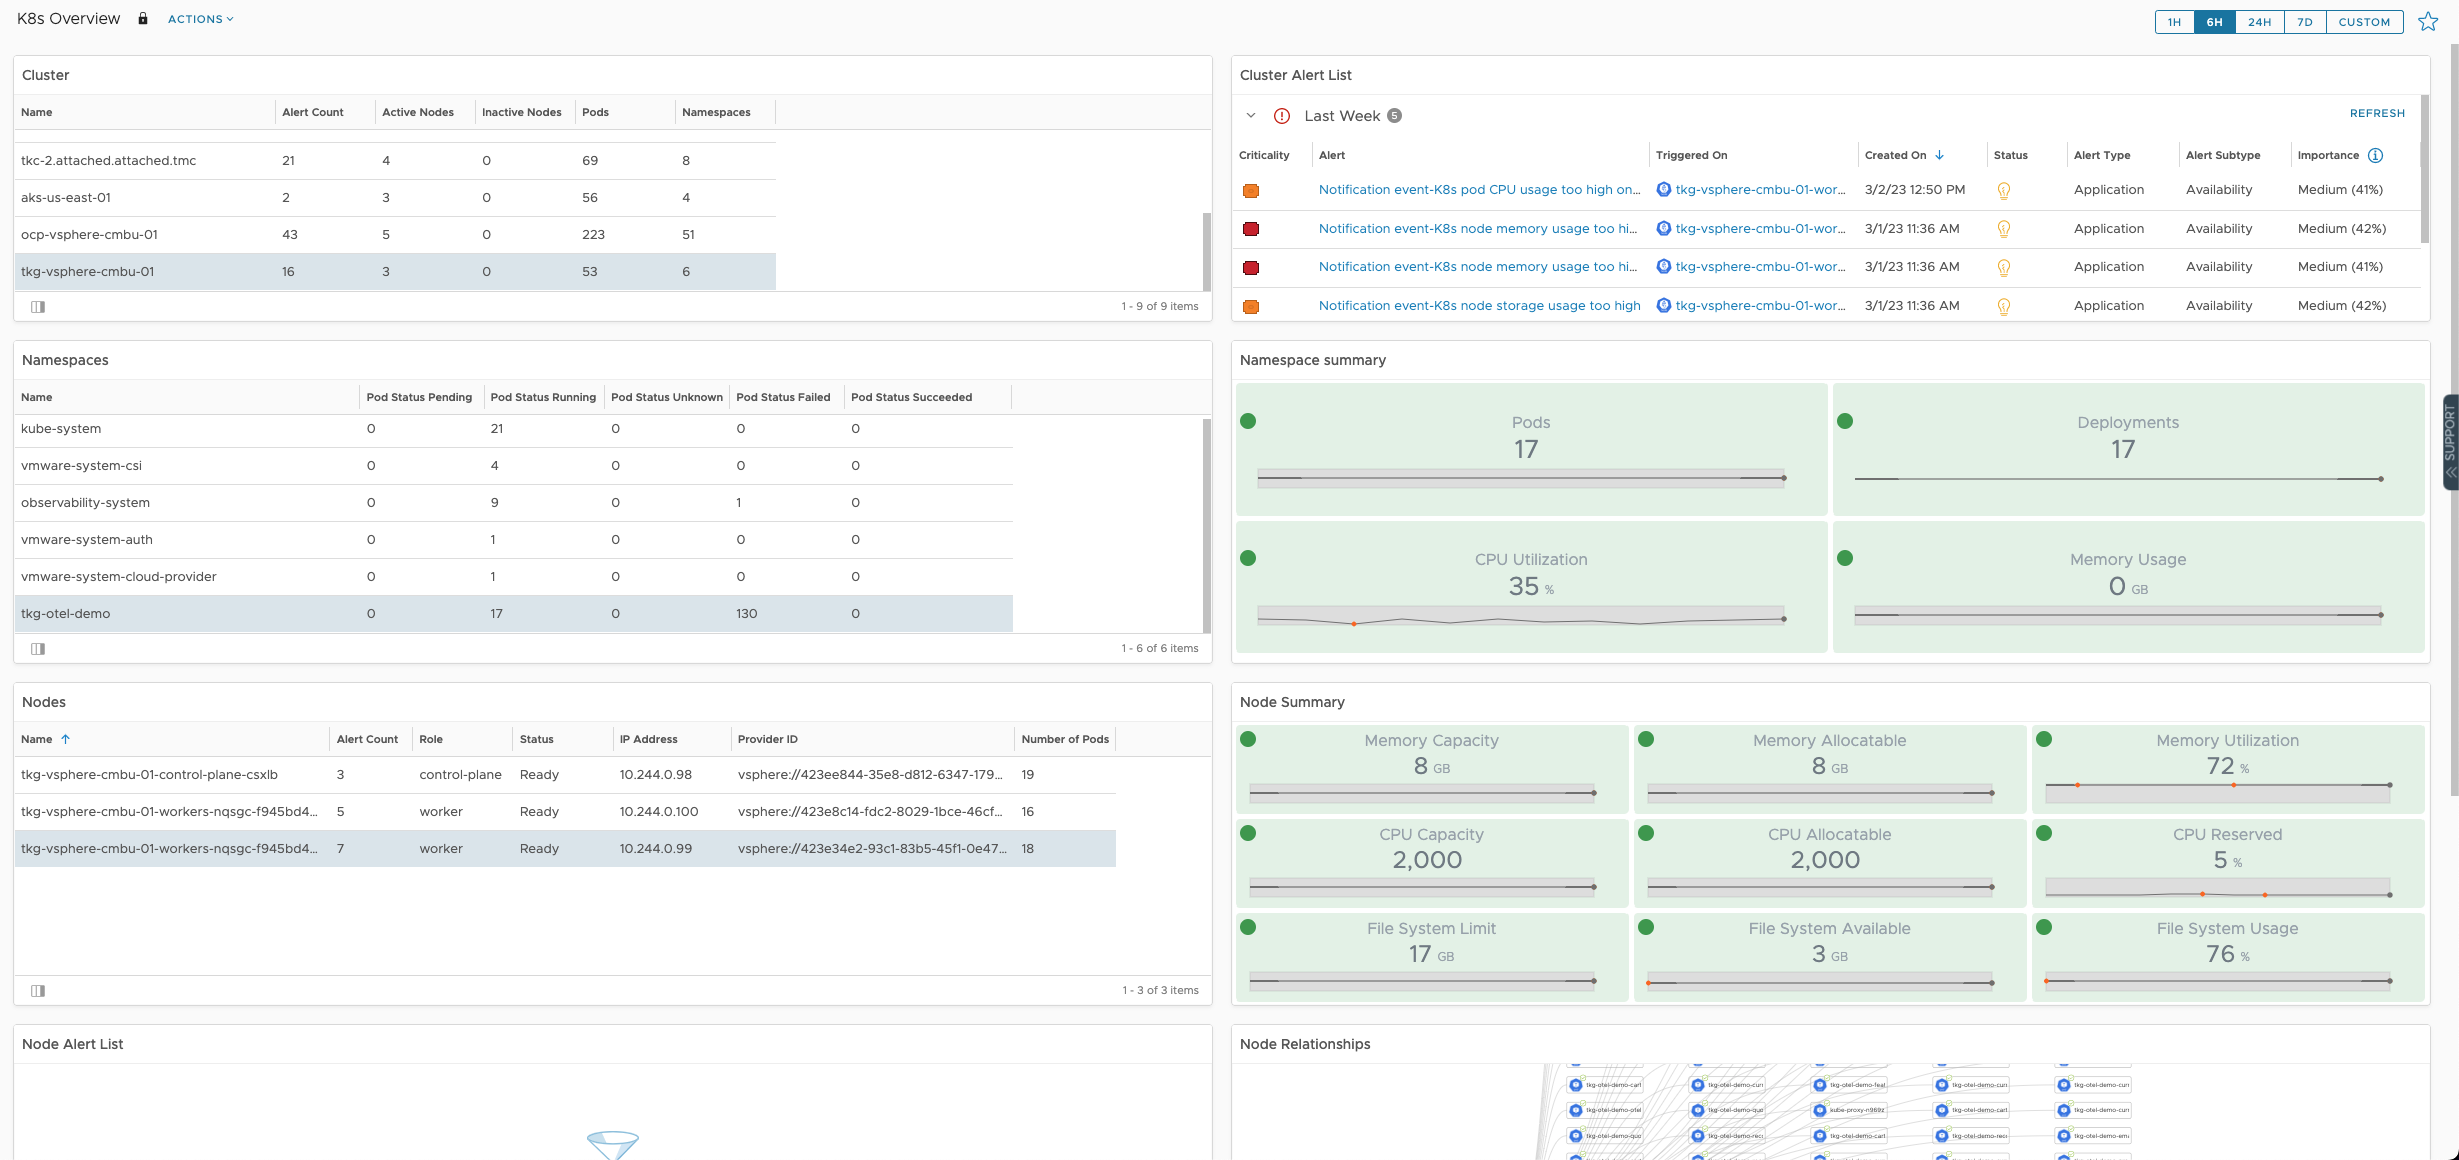
The K8s Overview dashboard provides an in-depth look at your Kubernetes clusters, including alerts, relationships, and metrics across your namespaces, nodes, and pods. Select a cluster from the top-left Clusters widget and the rest of the widgets will populate automatically. Within the selected cluster, you can select a node from the Nodes widget to see the metrics, alerts, and relationships for that node. Finally, you can select a pod object from the Pods widget to see that pod's alerts and relationships.
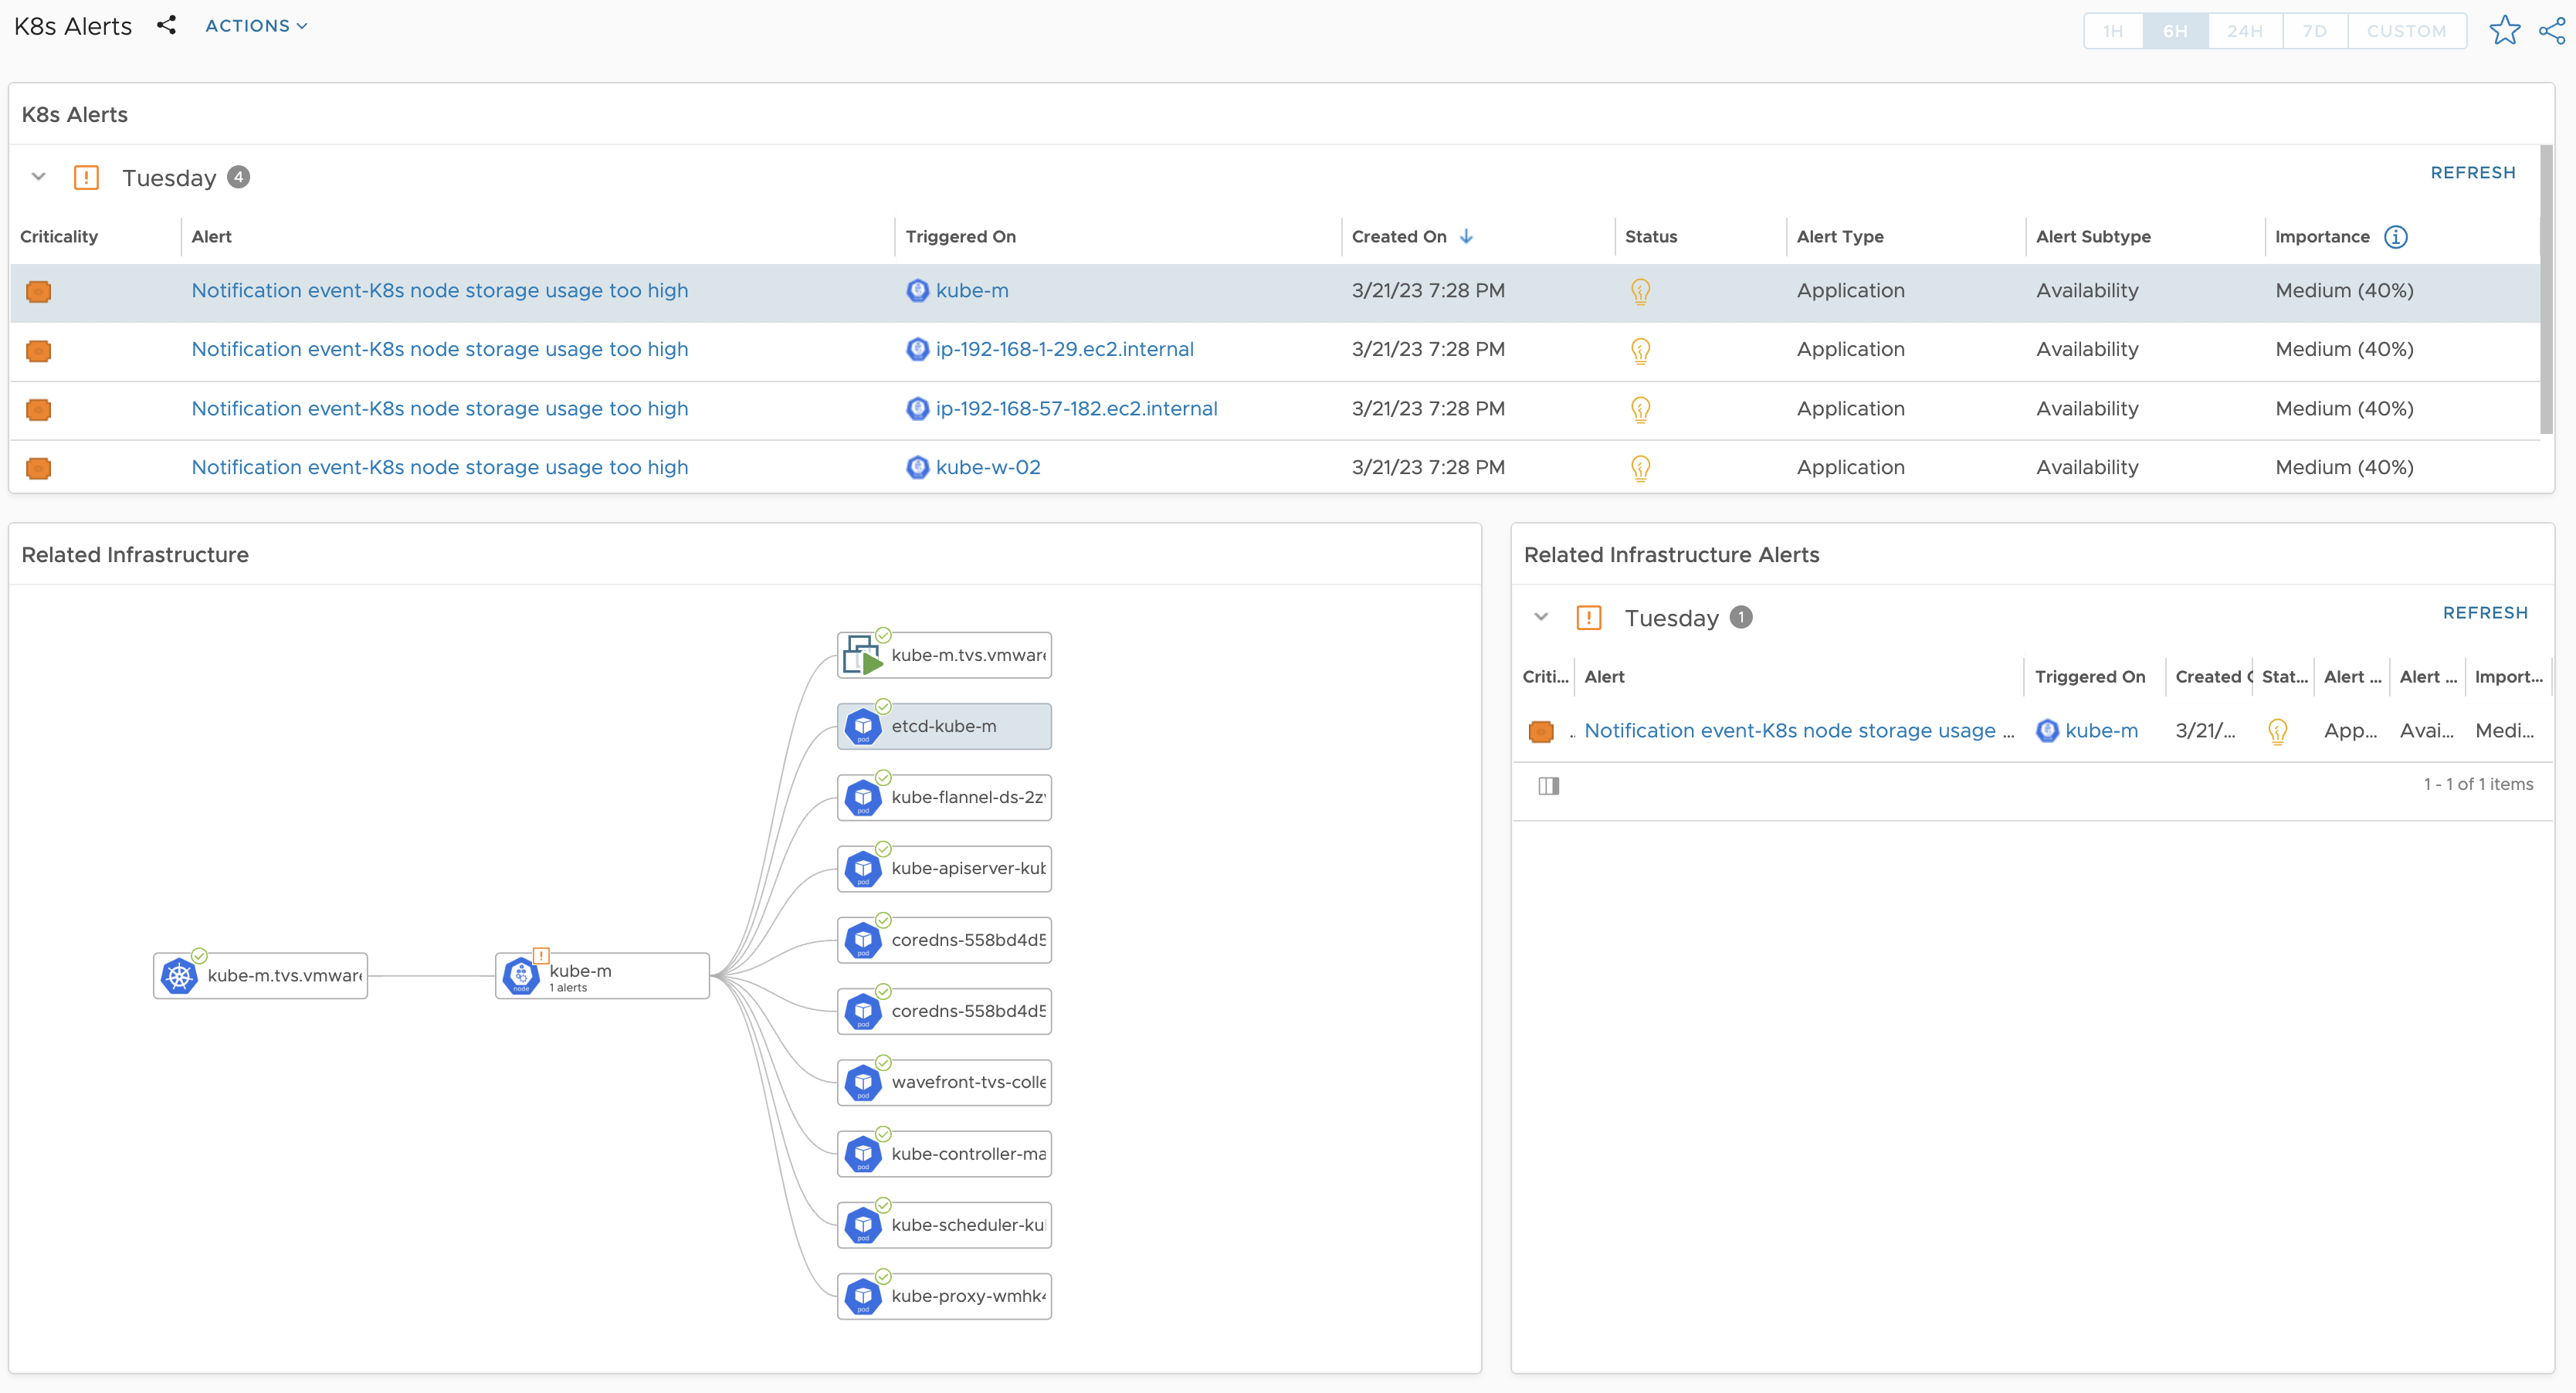
The K8s Alerts dashboard compiles all Kubernetes-related alerts in one place. Select an alert to see the impacted object and its related infrastructure objects. Select a related infrastructure object to see its alerts and metrics.
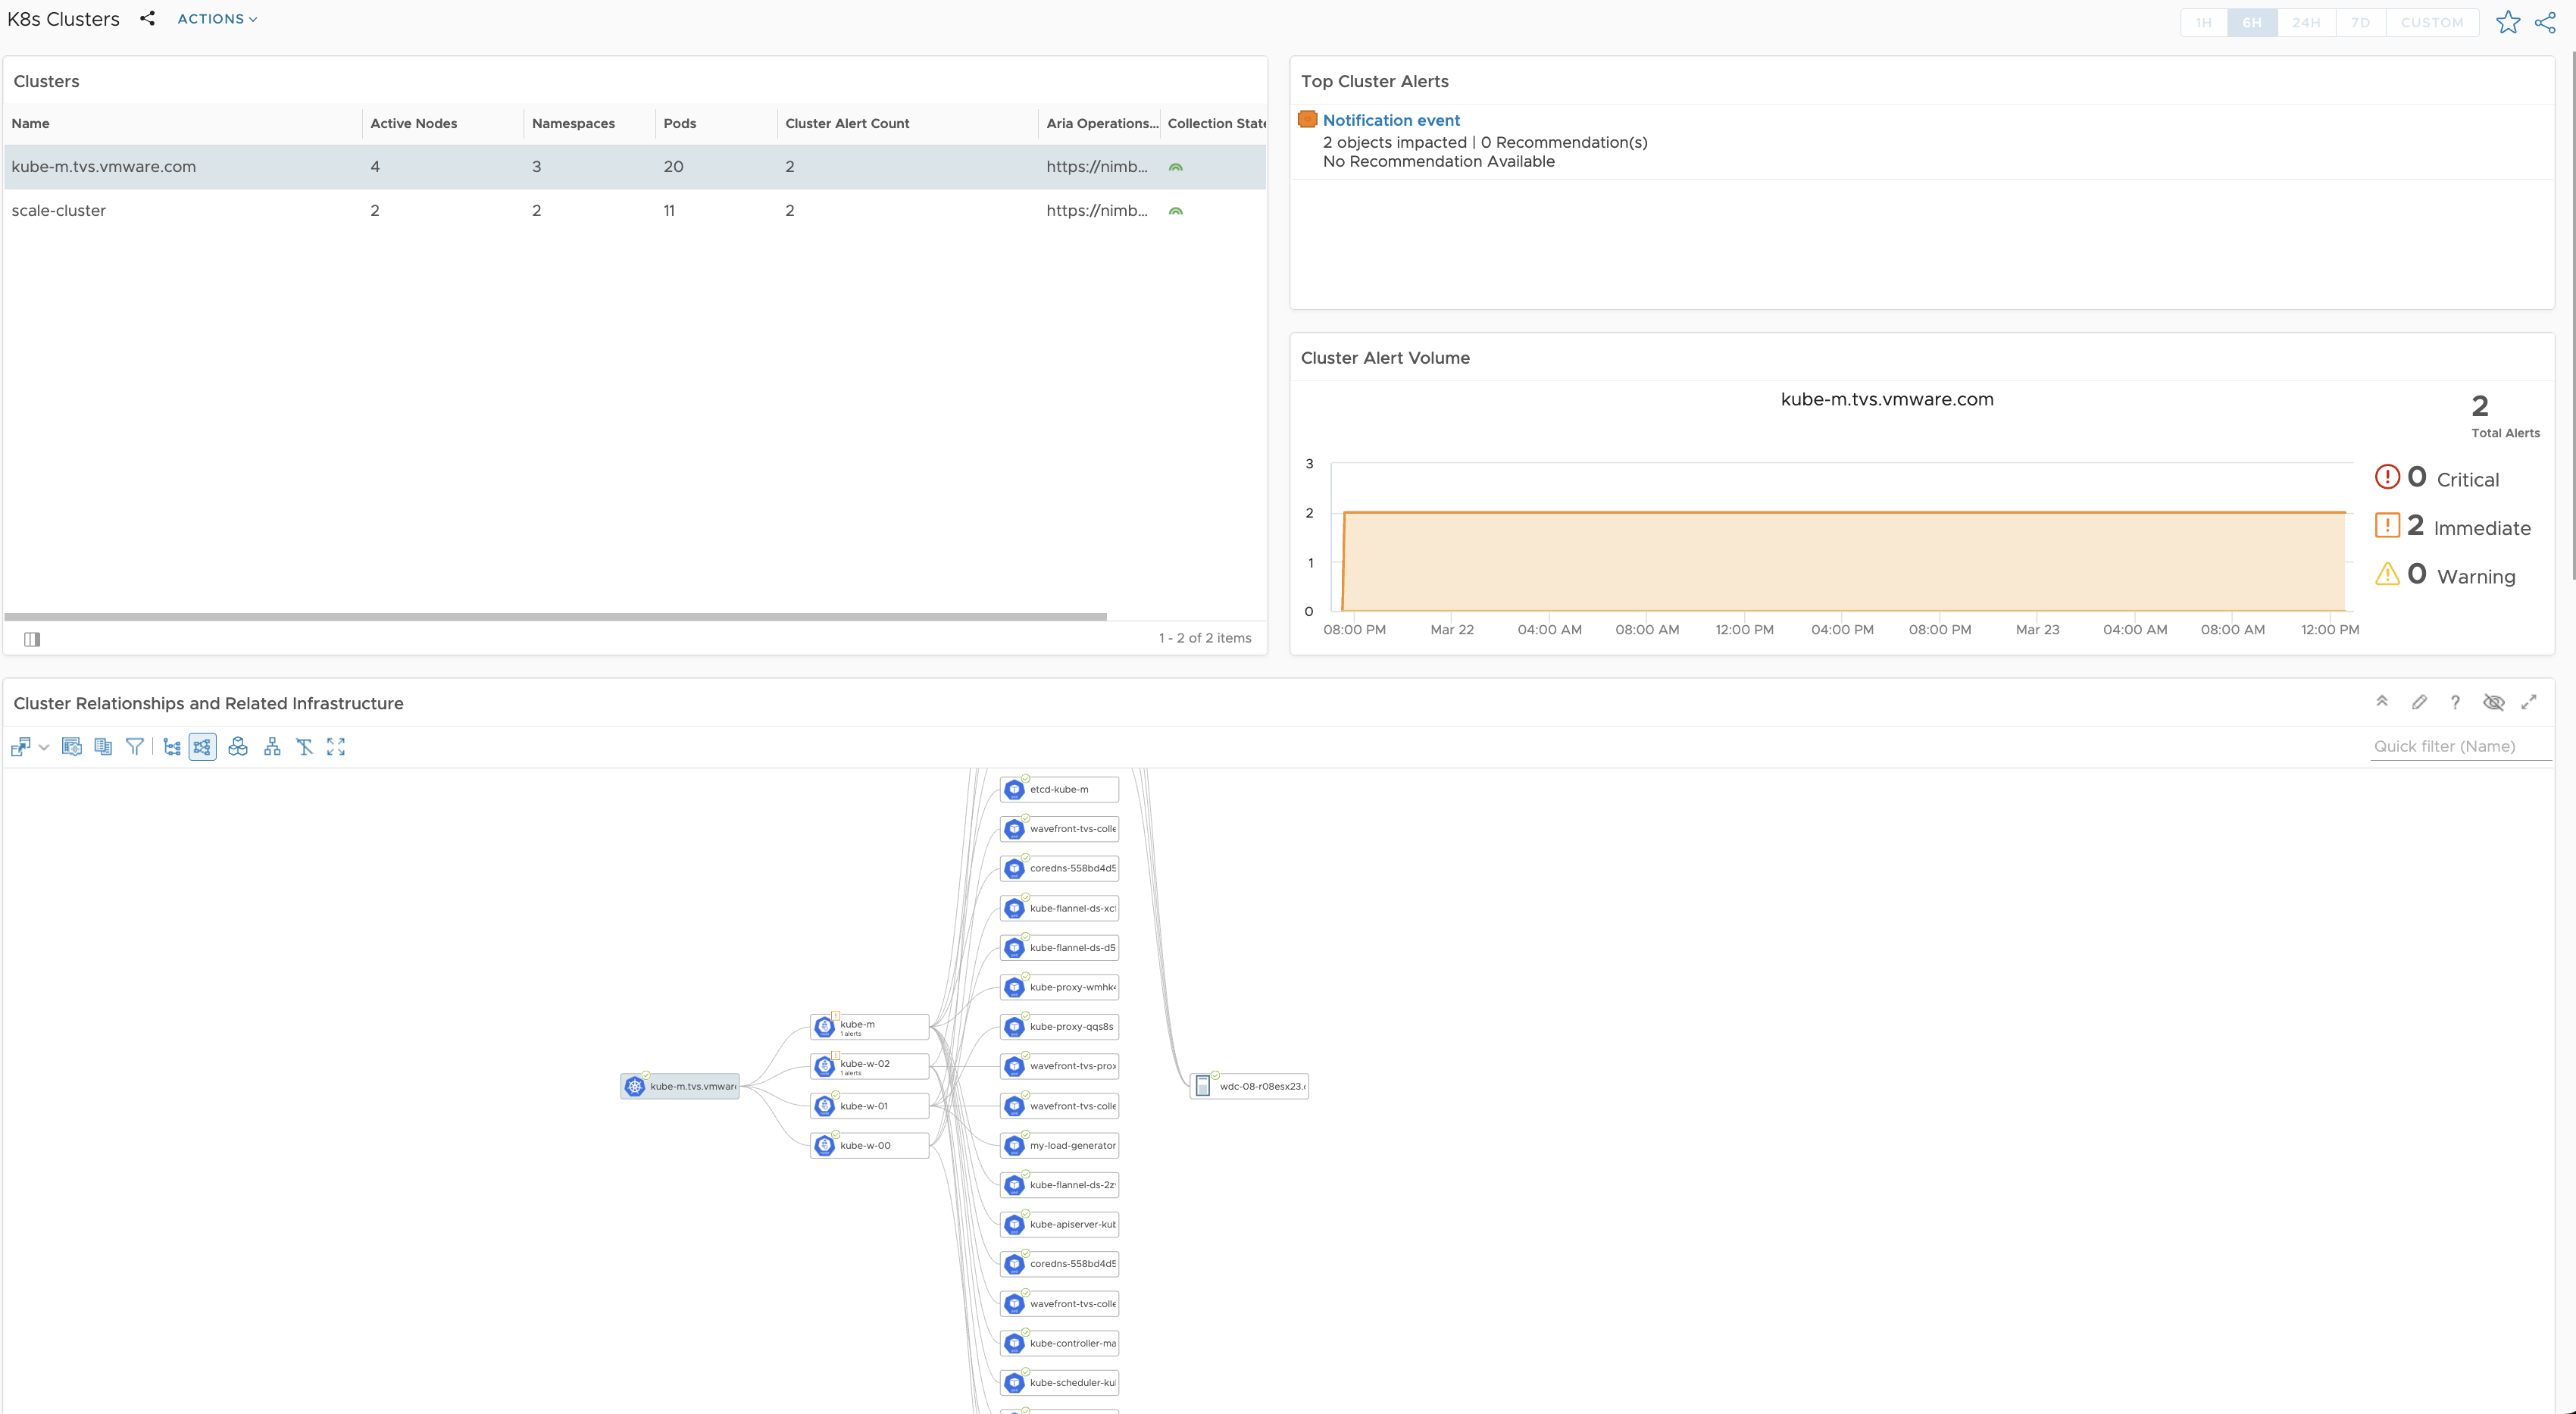
The K8s Clusters dashboard shows all your Kubernetes clusters in one place. Select a cluster to see its alerts, recent alert volume, and all its related objects and infrastructure. Select a related infrastructure object to see its summary metrics.
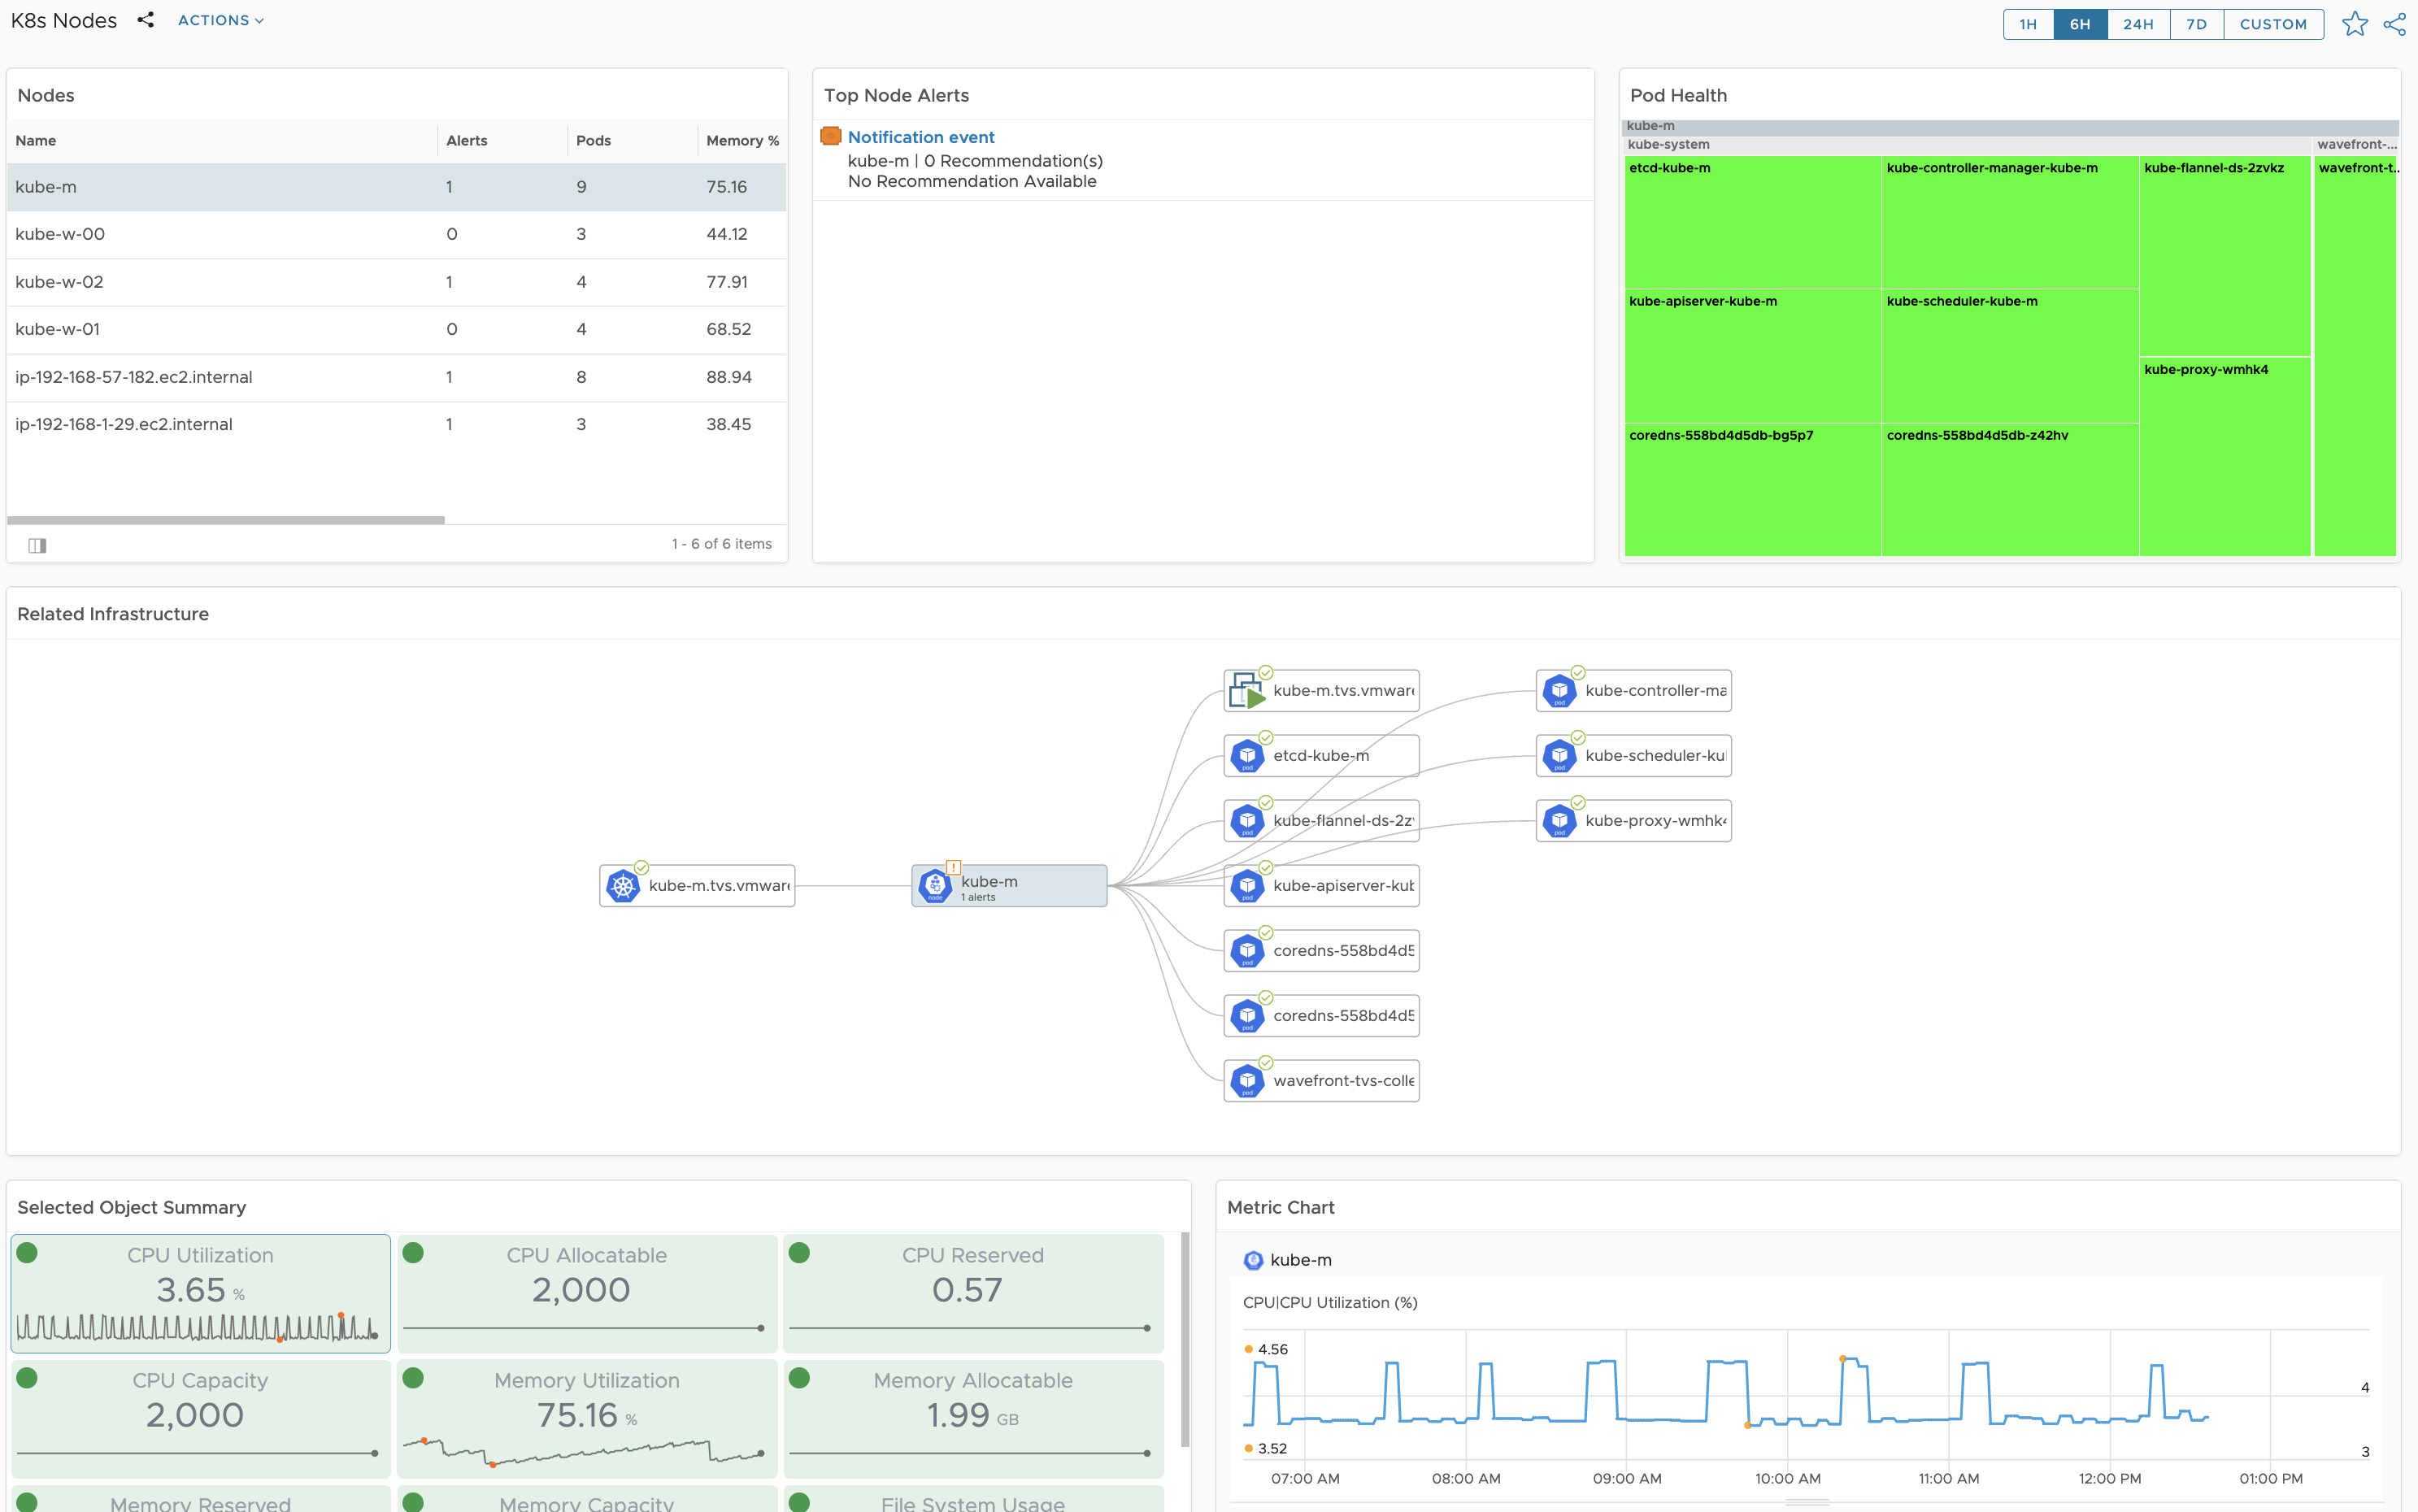
The K8s Nodes dashboard shows all the Kubernetes nodes across all your Kubernetes clusters in on place. Select a node to see its alerts, related pod health, and related infrastructure objects. Select a related infrastructure object to see its summary metrics.
