


The SDDC-Environment Growth dashboard provides an overview of growth in terms of resource usage in your SDDC environment. You can view the growth history of VMs and other resources on a monthly basis, this in turn helps you to plan your expenses for your SDDC.
You can use the dashboard widgets in several ways.
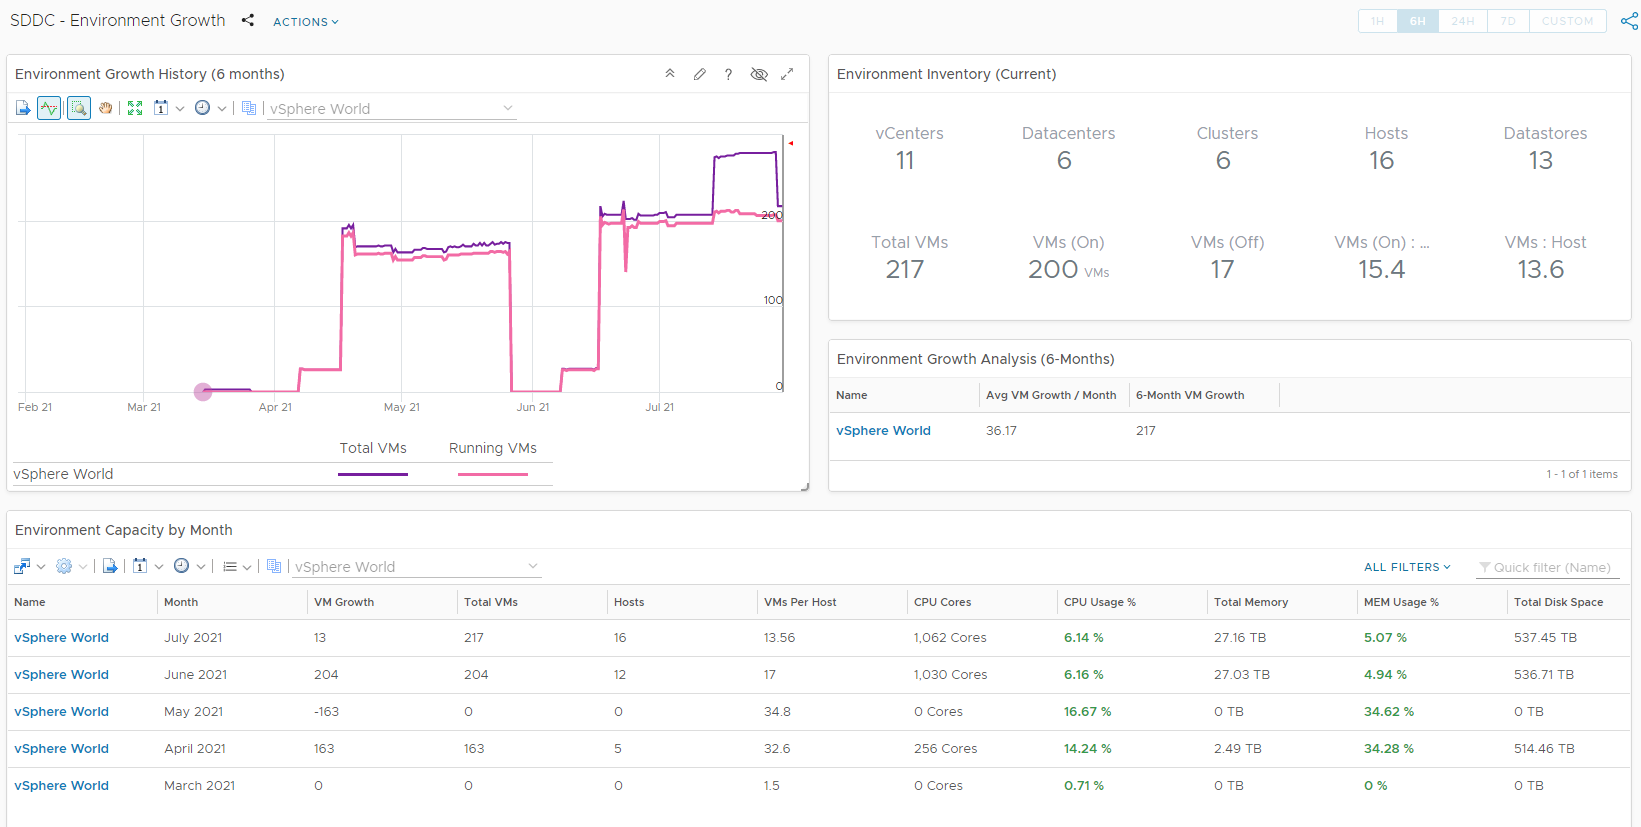
- Environment Growth History (6 months) – Use this widget to check the growth history of your total VMs versus running VMs for last six months.
- Environment Inventory (Current) – Use this widget to view the number of vCenters, data centers, clusters, hosts, datastores, and VMs in their different states in your current environment.
- Environment Growth Analysis (6-Months) – Use this widget to analyse the average VM growth per month and average VM growth for six months.
- Environment Capacity by Month – Use this widget to view the capacity growth in your environment per month.
- Environment Inventory Growth by Month - Use this widget to view the inventory growth in your environment per month.
