VMware Aria Operations for Logs provides several aggregation functions.
| Type | Field | Description |
|---|---|---|
| Count | Events only | Creates a chart of the number of events for a specific query. |
| Unique count | Any field | Creates a chart of the number of unique values for a field. |
| Minimum | Numeric fields only | Creates a chart of the minimum value for a field. |
| Maximum | Numeric fields only | Creates a chart of the maximum value for a field. |
| Average | Numeric fields only | Creates a chart of the average value for a field. |
| Std dev | Numeric fields only | Creates a chart of the standard deviation for a field’s values. |
| Sum | Numeric fields only | Creates a chart of the sum of values for a field. |
| Variance | Numeric fields only | Creates a chart of the variance for the values of a field. |
You can modify the way you view the query results.
| View | Description |
|---|---|
| To group query results by specific field values | Use the second drop-down menu under the chart to group query results by specific field values rather than or in addition to time series. |
| To view the number of events for a field | For example, the number of events per host, deselect the Time series check box and select the check box for that field. |
| To view a stacked bar chart for a field with groupings over time | Select both the Time series check box and the field check box. |
Examples of Aggregation Functions
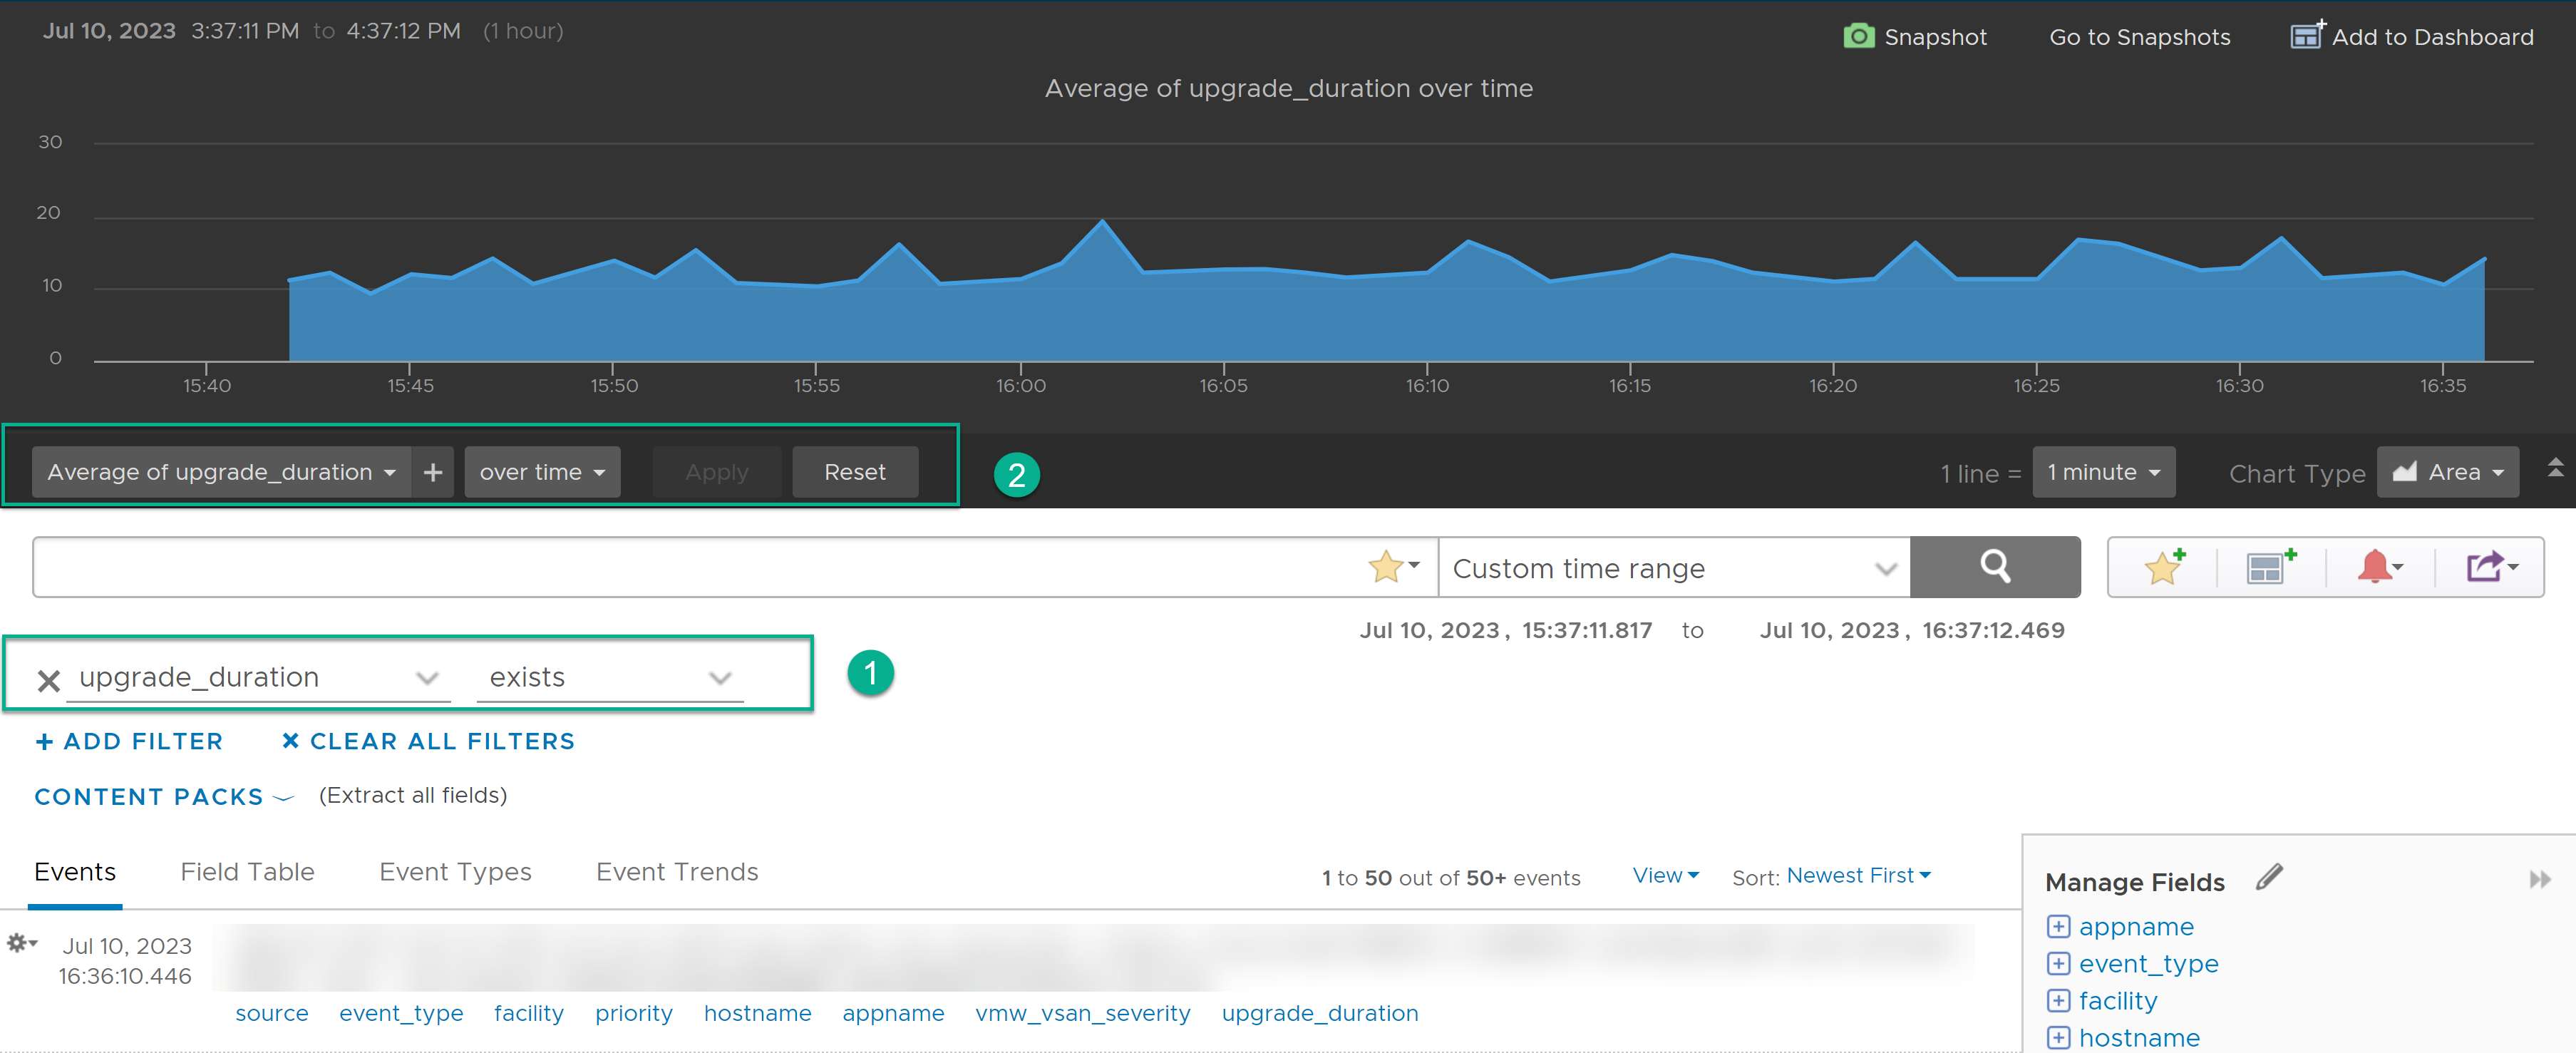
An area chart displaying the average upgrade duration over time:
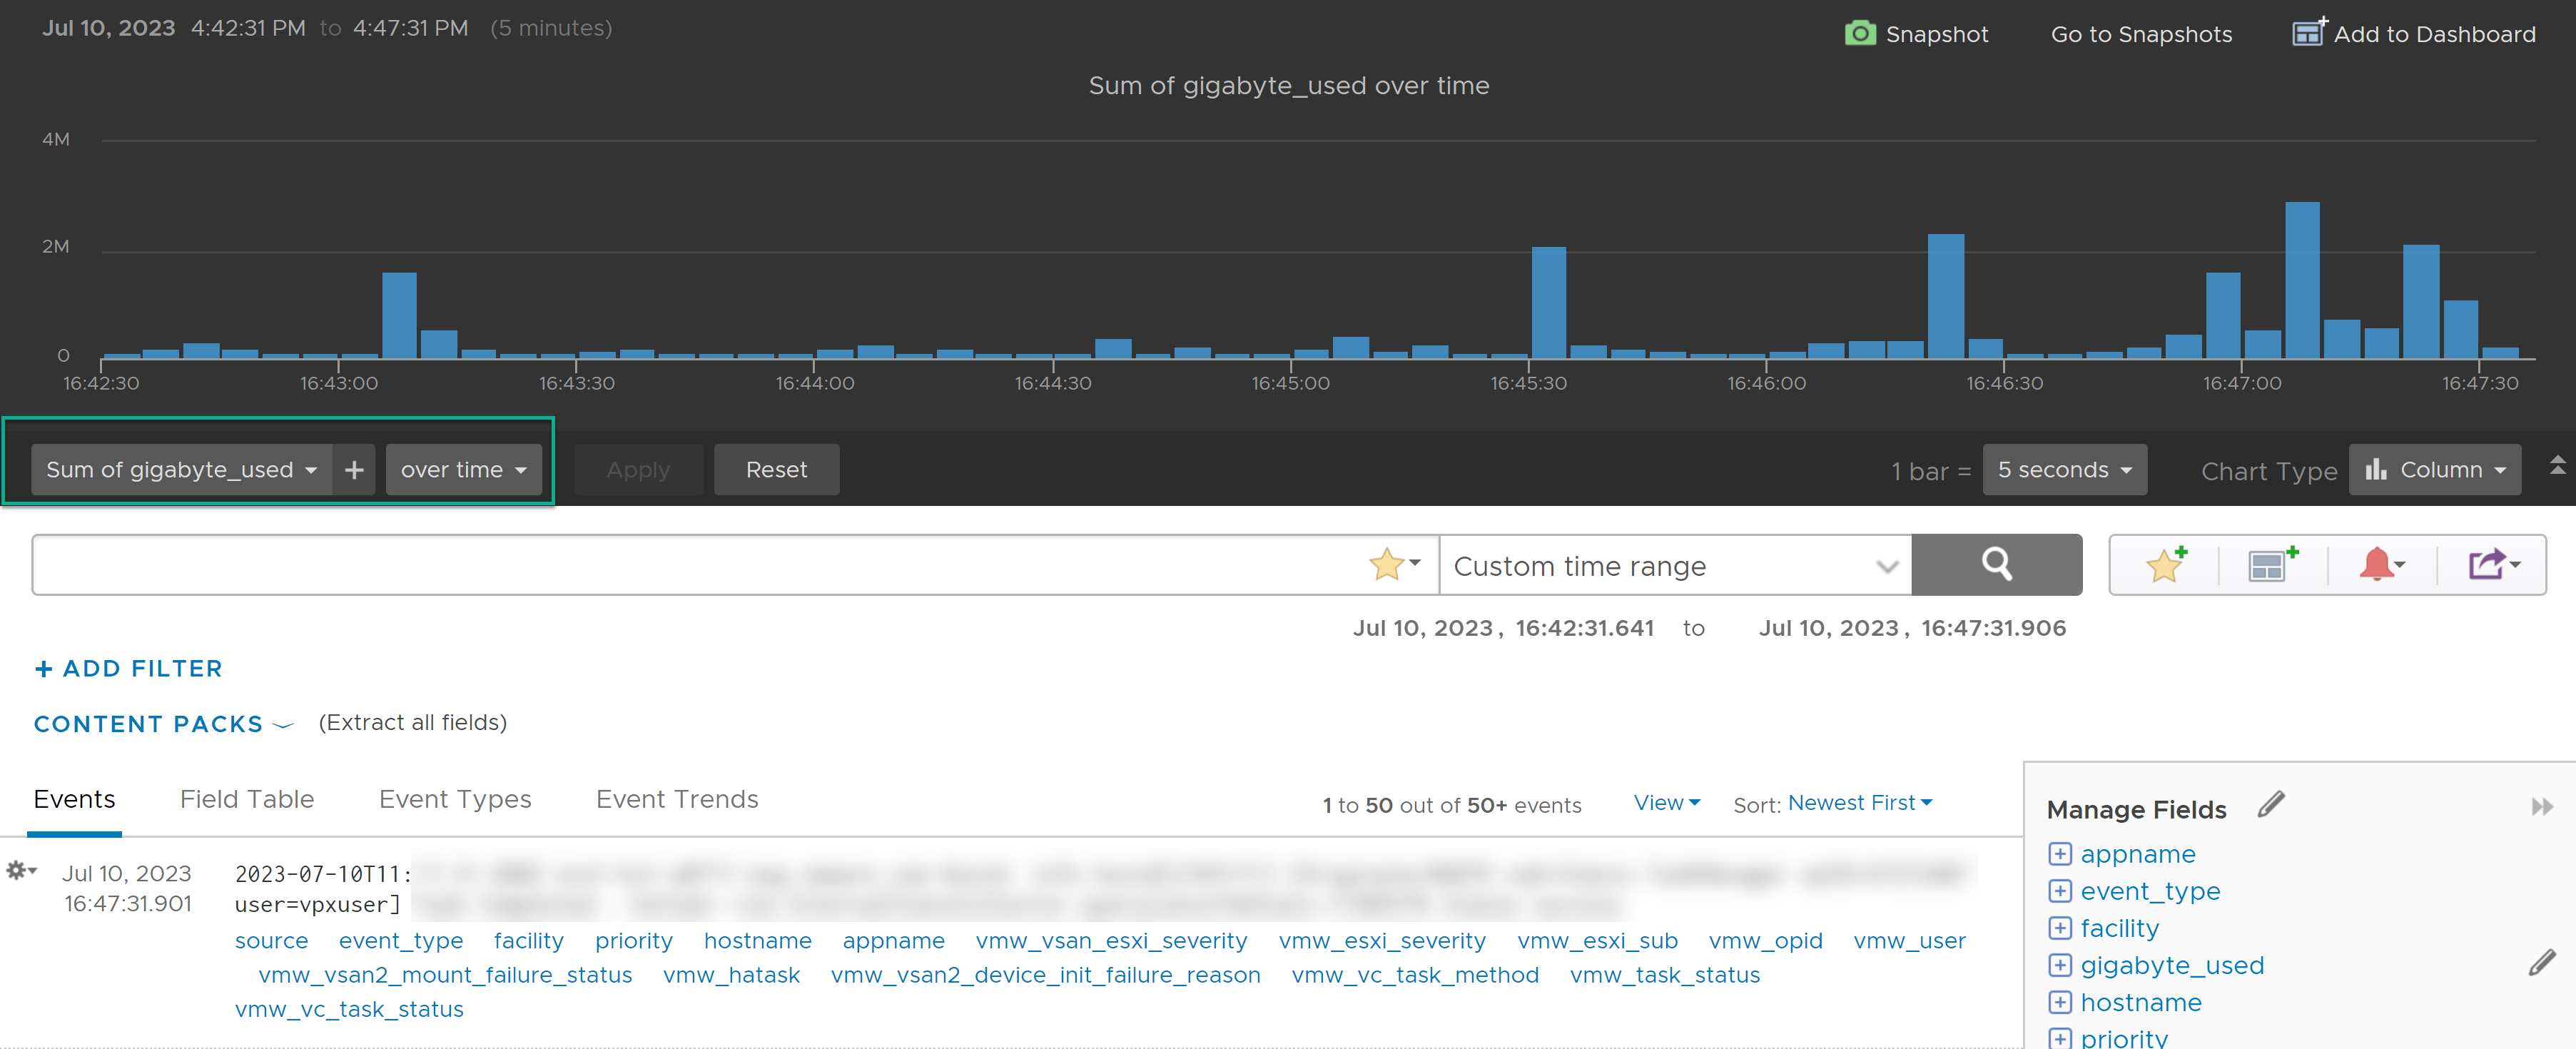
A column chart displaying the sum of gigabytes used over time:
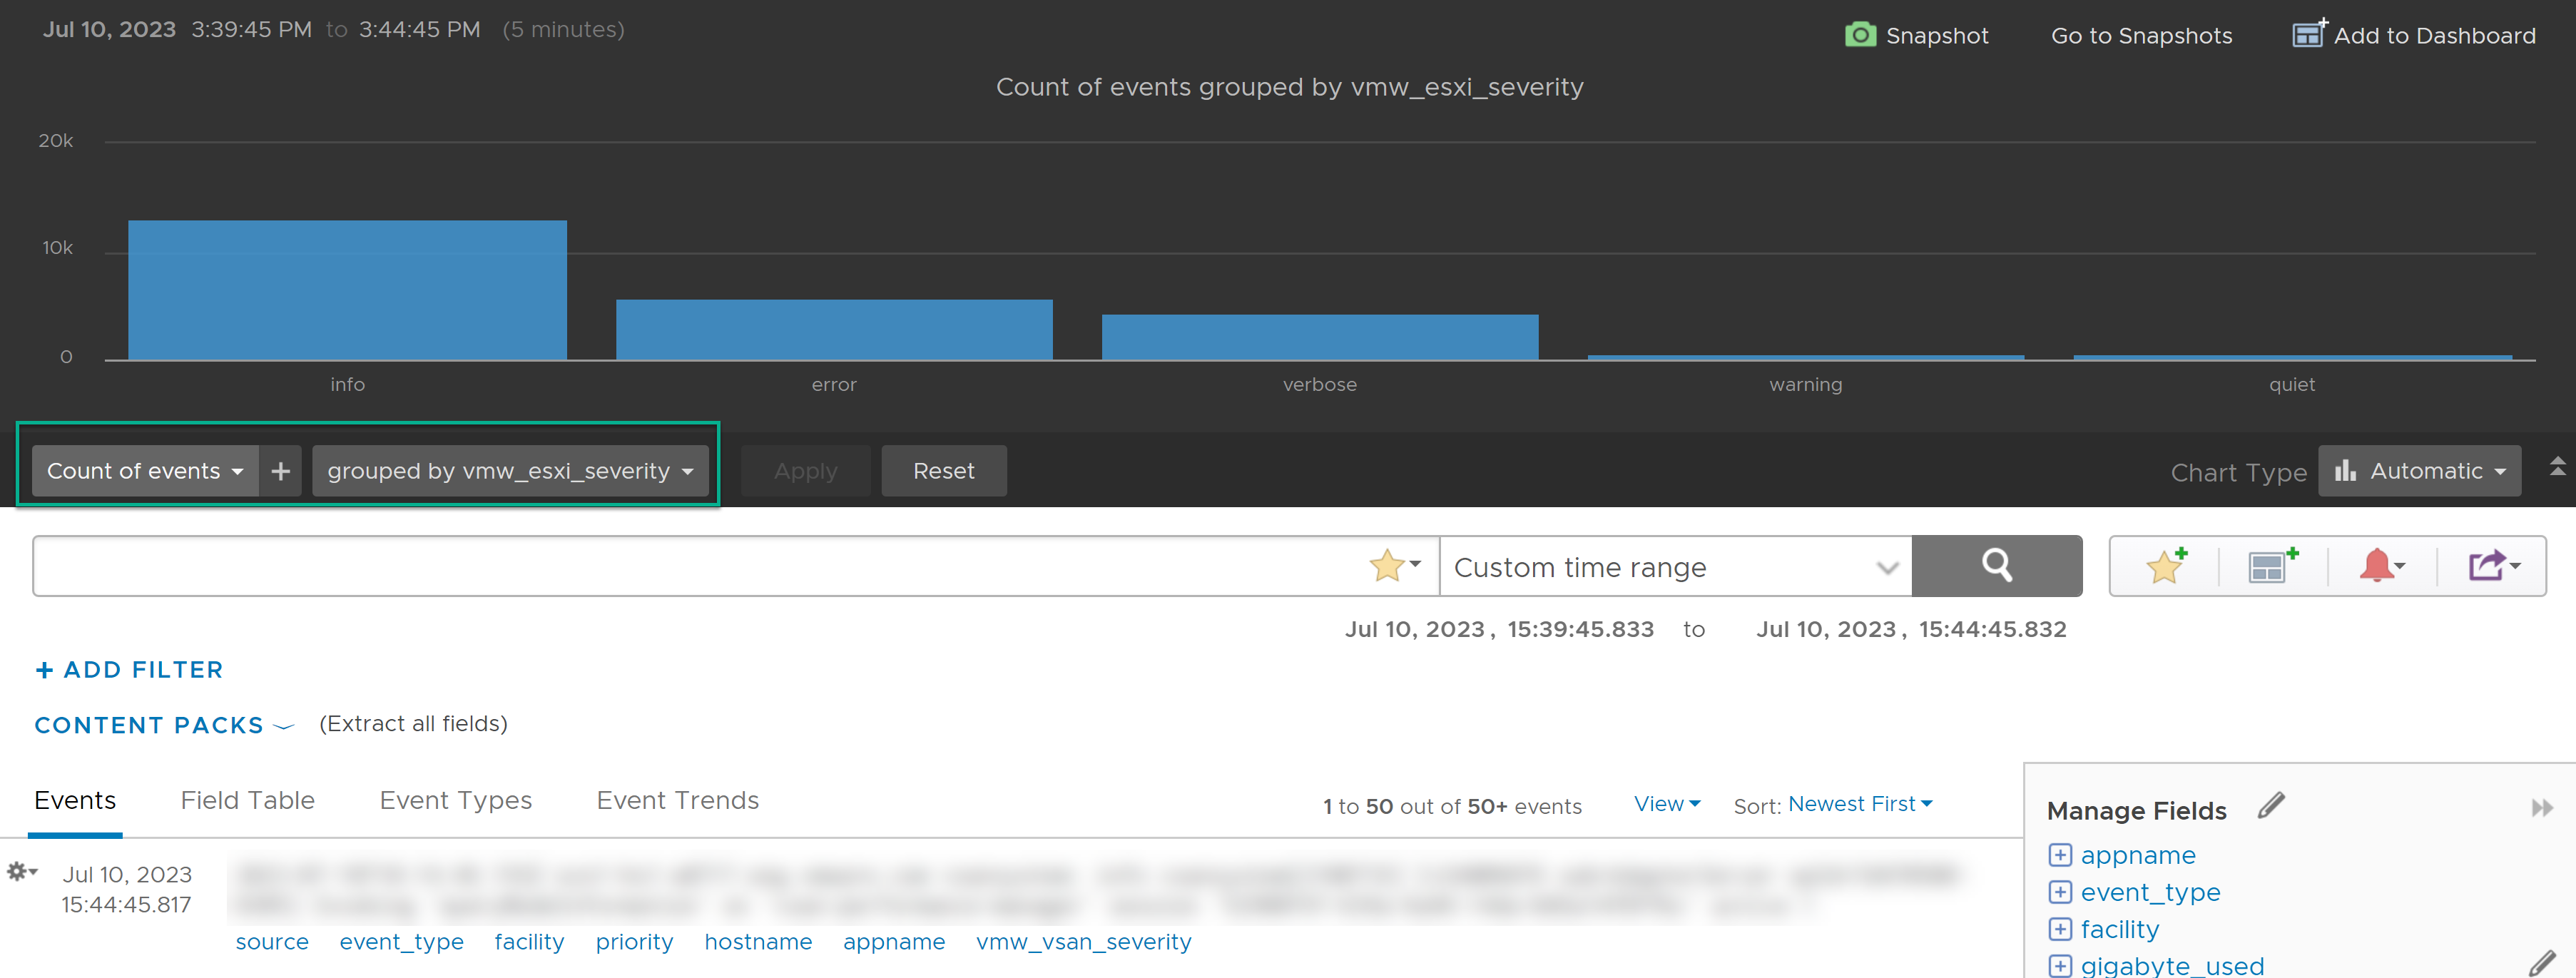
A column chart displaying the count of events grouped by severity: