


You can view the alerts that have been triggered in the last hour, day, or week. You can also view details for the last 100 alerts triggered.
To view the recent alerts triggered for your region or organization, expand the main menu and select . You can search for alerts by entering keywords in the search text box or by using the filter. You can filter alerts by severity, type, and tags. Alerts appear in a time-line view and a detailed view.
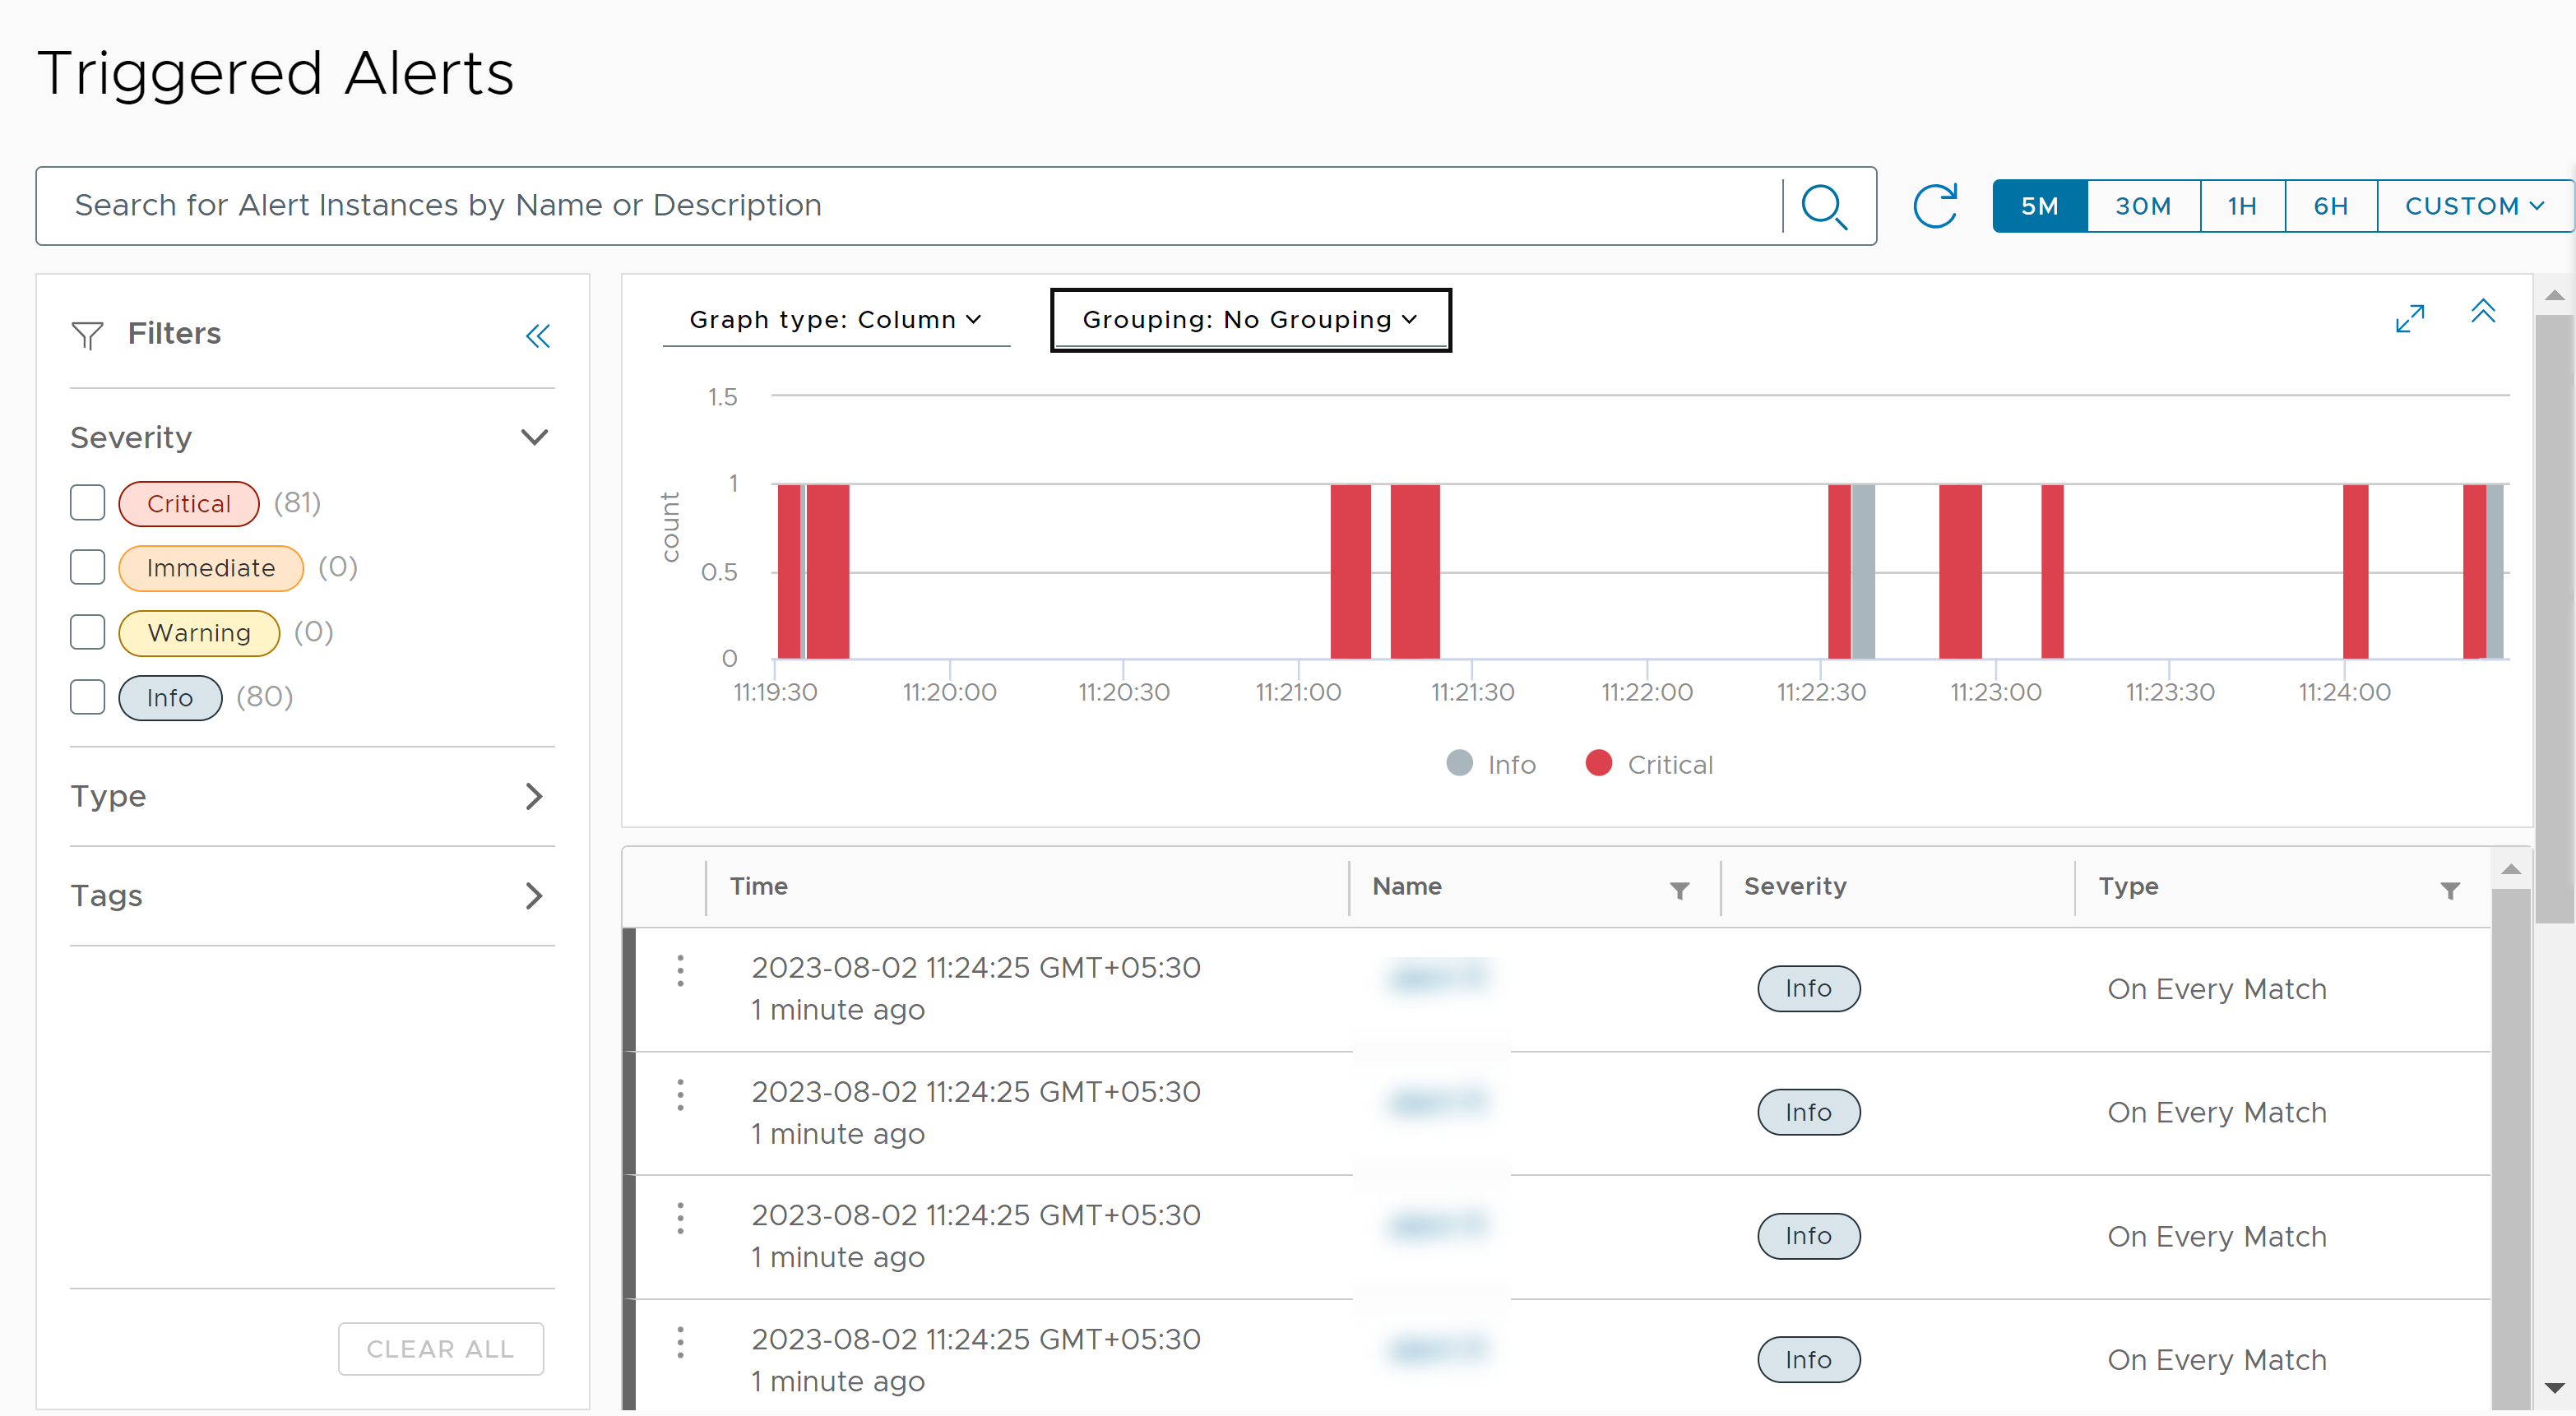
Time-Line View
The first panel displays a graphical time-line view of the recent alerts. You can do the following:
- Click a period in the upper-right corner of the panel to view the alerts triggered during the period.
- Hover over each alert in the time-line to view the time at which the alert was triggered.
- Select a grouping and a graph type based on the grouping.
- Expand the panel for a better view of the alert graph. You can also collapse the panel if required.
Detailed View
The second panel displays the following details for the last 100 alerts triggered for your region or organization:
- Name and description of the alert
- Tags associated with the alert
- Severity of the alert
- The alert type
Note: Periodic alerts are of the type "Total Count" and real-time alerts are of the type "On Every Match".
- Time at which the alert was triggered
- How long ago the alert was triggered
When you click the three dots icon for an alert, you can do the following:
- Click Details to view the data and threshold with which the alert was triggered.
- Click Definition to view the alert definition, the query on which the alert is based, and the alert instances. You can also modify, enable or deactivate, or remove the alert definition.
Tip: To view the triggered alerts for a specific alert definition, open an alert definition in
and click the
Alert Instances tab.
