


Usage reports show how VMware Aria Operations for Logs (SaaS) is used across the organization - the volume of log data ingested and stored, log statistics, recent queries, and active users. Usage reports also allow us to configure daily and monthly log ingestion limits.
You can view usage reports when you expand the main menu and select . The reports are categorized into the following tabs:
Ingestion & Storage Summary
The Ingestion & Storage Summary tab displays details about the amount of log data streamed into the system, the log volume in indexed and non-indexed storage, and the volume of non-billable logs ingested in the last 7-30 days. You can select the period for which the data is displayed. You must select a minimum period of seven days. You can select up to a maximum period of 30 days.
- Usage Summary
-
The Usage Summary section displays the following information:
Information Description Today's Ingestion The volume of logs ingested since 00:00 UTC. Ingestion Volume The volume of logs ingested within the selected period. Indexed Storage The volume of logs ingested into indexed storage within the selected period. Non-indexed Storage The volume of logs ingested into non-indexed storage within the selected period. Non-indexed Scan The volume of logs parsed for queries run on non-indexed storage, including recalled logs. Non-billable Logs The volume of logs that are not billed. - Ingestion
- This chart displays the volume of logs ingested daily within the selected period. You can choose to view billable logs, non-billable logs, or both.
- Top 5 Partitions (by Storage)
- This chart displays the top five partitions with the largest volume of logs ingested within the selected period. You can choose to view the log volume in the top five indexed partitions, non-indexed partitions, or both.
- Storage
- This chart displays the daily ingestion of non-billable logs and logs in indexed and non-indexed storage, within the selected period. You can choose to view logs in indexed storage, logs in non-indexed storage, non-billable logs, or all of them. In the upper-right corner of the chart, you can select the partitions for which you want to view the log data. You can select multiple indexed partitions, multiple non-indexed partitions, or both.
- Filtered Logs
- This chart displays the volume of filtered logs ingested daily within the selected period. You can choose to view logs filtered at source, logs filtered at VMware Aria Operations for Logs (SaaS), or both.
To download a report of the ingestion and storage within the selected period in CSV format, click Download CSV in the upper-right corner of the tab.
Queries
The Queries tab displays information about the log volume scanned, the total number of queries executed, and the number of unique users executing queries. You can view charts with details about the logs examined over time, the logs examined per page, and the number of queries executed over time. Additionally, the tab also displays a table with more information about each query such as the query filter, the partitions in which the query is executed, the time range used in the query, and so on. By default, this information is displayed for indexed storage and a time range of the last 30 minutes. However, you can change the storage type to non-indexed and select a different time range.
- Queries Summary
-
This section displays the following information:
Information Description Volume Scanned The volume of logs examined in the selected storage type within the selected time range. Total Queries The total number of queries executed in the selected storage type within the selected time range. Unique Users The number of unique users who have executed queries in the selected storage type within the selected time range. - Data Scanned over Time
- This chart displays the volume of logs (in GB) examined in the selected storage type over the selected period of time.
- Data Scanned per Page
- This chart displays the volume of logs (in GB) examined per page in the selected storage type within the selected time range.
- Total Queries over Time
- This chart displays the number of queries executed in the selected storage type over the selected period of time.
- Queries
-
This table displays the following information about the queries executed in the selected storage type within the selected time range.
Column Name Description Query The filter used to execute the query. If a filter was not used, No Filter is displayed. You can filter this column to narrow the results.
Partitions The partitions in which the query was executed. Time Window The time range used while executing the query. Data Scanned The volume of logs examined when the query was executed. Status The status of the query, whether it is finished or still running. Triggered By The user who executed the query. You can filter this column to narrow the results.
Triggered At The time at which the query was executed. Query Page The source of the query. Tip: This is a hidden column. Click the column picker and select the column name to view it.You can sort the queries by the most recent queries or by the queries with the most logs scanned.
Active Sessions
The Active Sessions tab displays a list of users who are logged into the system. It also shows more information about these users, such as active sessions and time of logging in. You can sort and filter the users by their email addresses.
Ingestion Limits
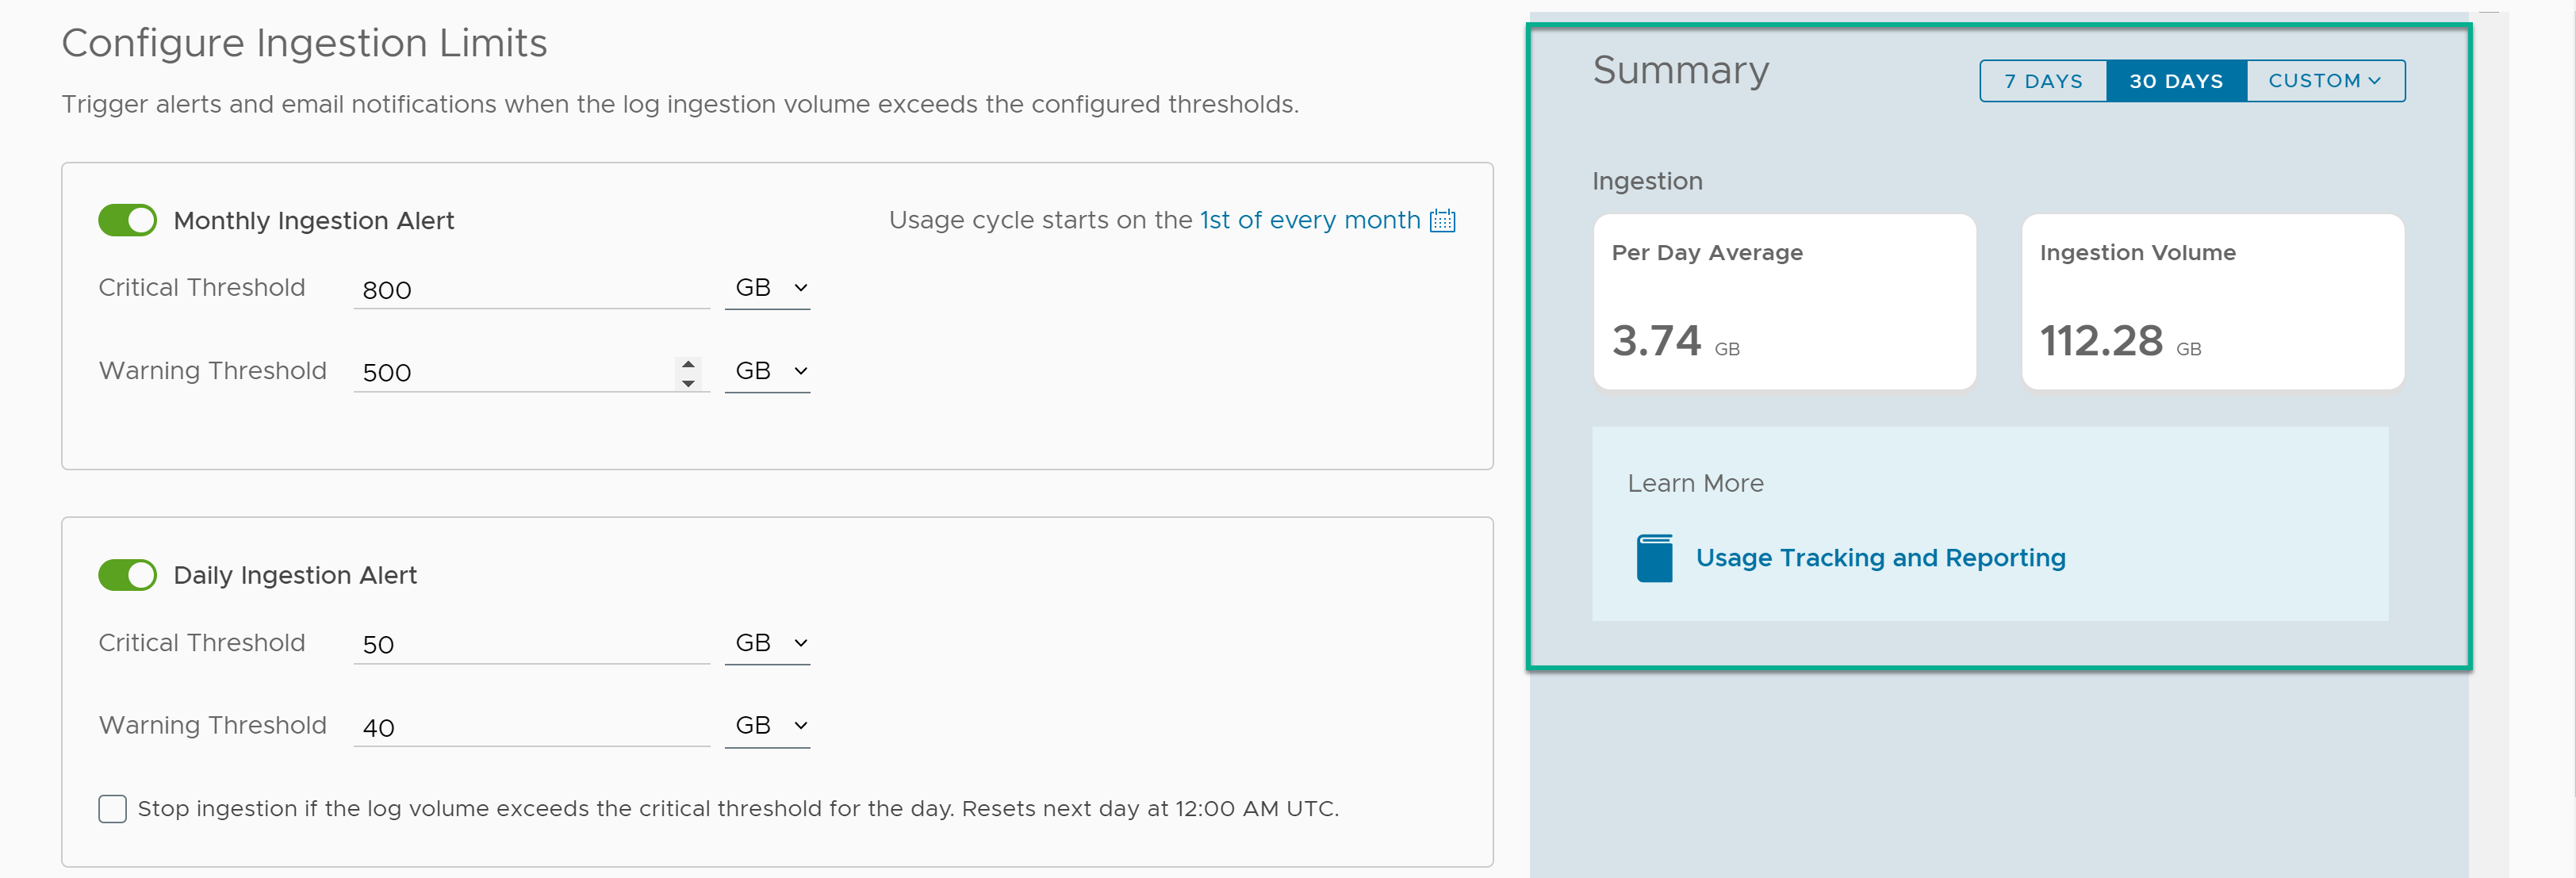
The Ingestion Limits tab allows you to configure daily and monthly log ingestion limits. Configuring log ingestion limits help you manage unexpected increase in log volume and limit unplanned charges whenever a specified threshold is reached.
You can set two types of threshold limits for log ingestion.
| Threshold Limit | Description |
|---|---|
| Warning | You set a warning log ingestion limit to be notified when you are nearing the log ingestion limit before the end of the UTC day or your monthly cycle. |
| Critical | You set a critical log ingestion limit to:
|
To determine the warning and critical limits for your account, you can view the log ingestion summary at the far right of the screen. The summary provides information about the average log ingested per day and the total volume of logs ingested during the current monthly cycle for your account.
To learn how to configure ingestion limits, see Configure Log Ingestion Limits.
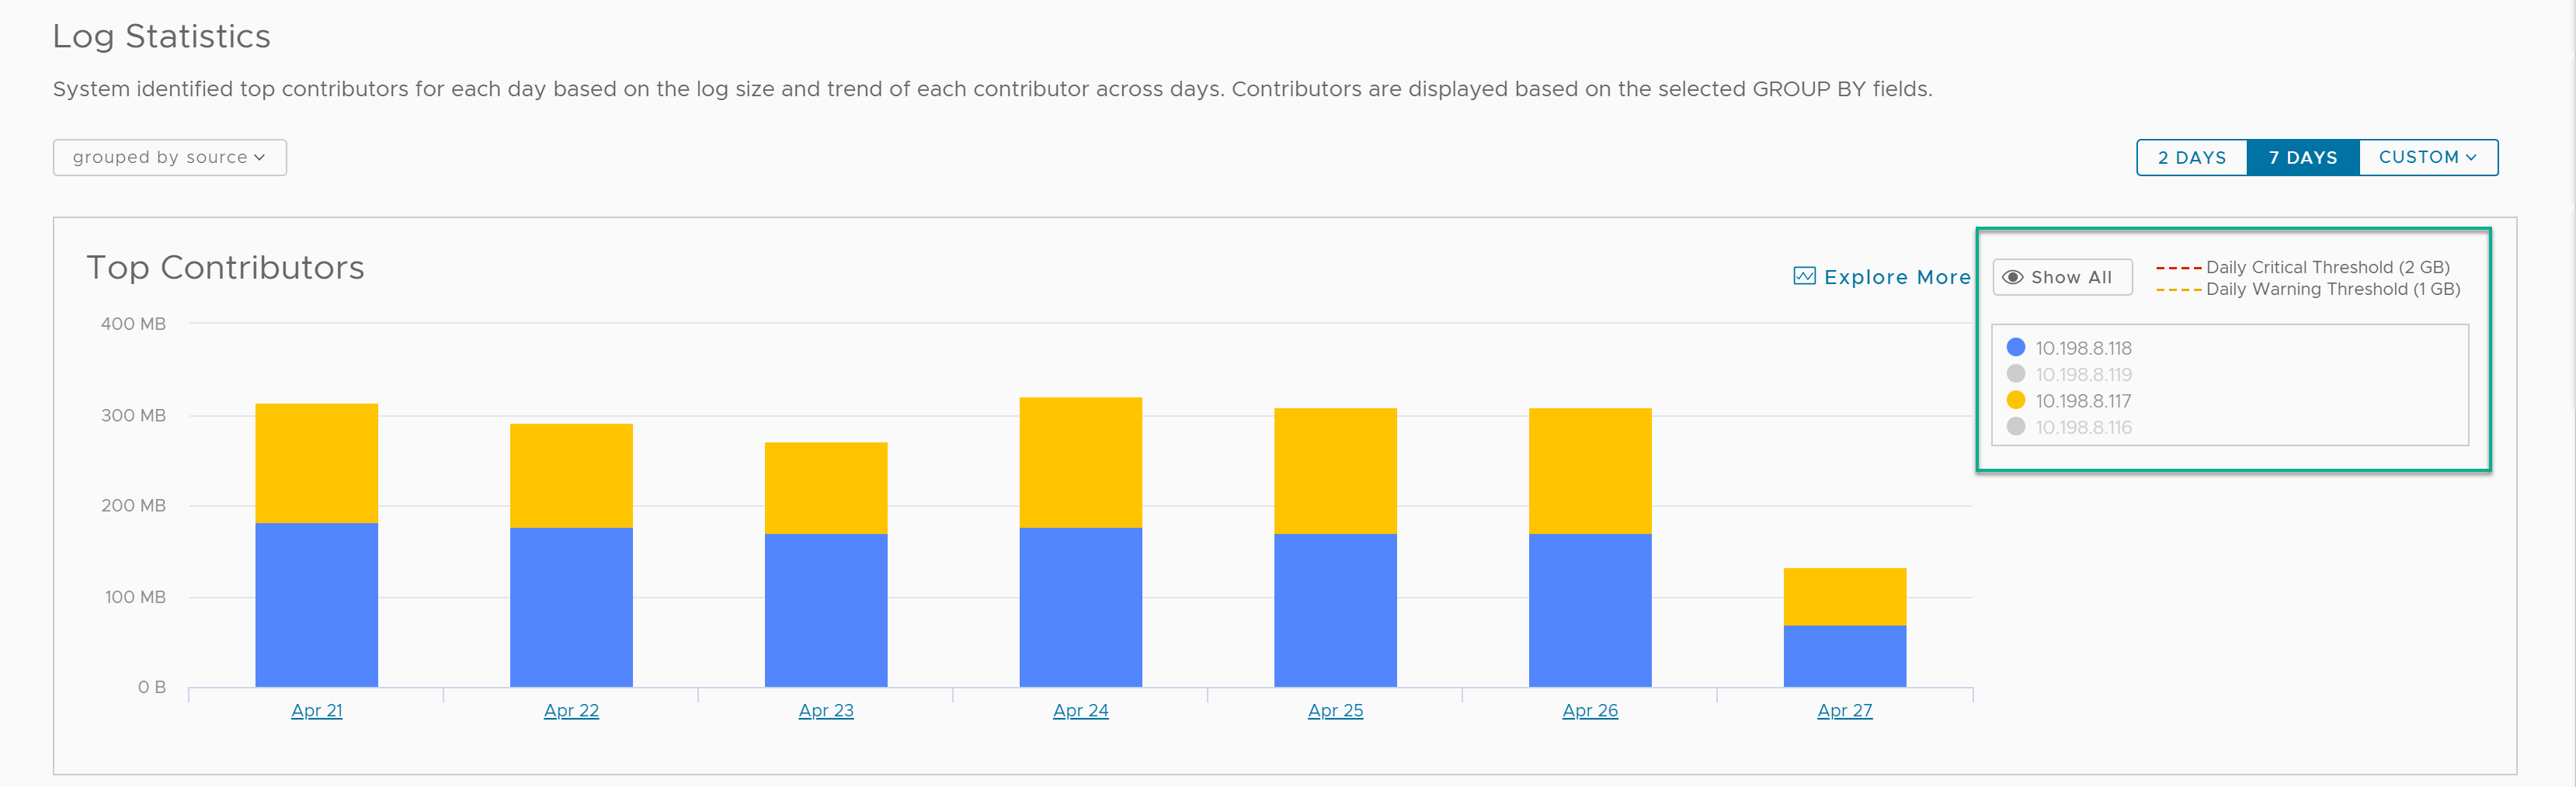
Log Statistics
This tab displays the top log contributors for each day based on:
- The size of logs generated.
- Selected fields in the Grouped By drop-down menu.
By default, top log contributors for the last seven days are displayed in the chart where each color represents logs contributed by the selected grouped by fields.
You can modify the chart to:
- Select the period for which you want to see the top log contributors. You can view log contributors for two days or select Custom and select dates within the range of seven days.
- Group log contributors by one or more fields.
By default, log contributors are grouped by source. You can modify the default settings by selecting other fields such as source, appname, hostname and contributors using the grouped by drop-down menu.
Note: You can select a maximum of three fields in the Grouped By drop-down menu. - Select or deselect one or more grouped by fields in the legend.
You can select Hide All to deselect all the grouped by fields and manually select the fields of your choice.
- Select a date on the chart to view the log usage trend for that date.
- Select a color (that represents the selected grouped by fields) on the chart to view the log usage trend of that field.
