You can define an alert to notify users when specific data appears in the logs. An alert is based on a query.

Prerequisites

Verify that you are logged in to the VMware Aria Operations for Logs (SaaS) web user interface as an administrator.

Procedure

  1. Click the two arrows icon in the upper-left corner of the screen to expand the main menu.
  2. Navigate to Alerts > Alert Definitions.
  3. On the upper-right corner of the page, click Create New.
    Tip: Alternatively you can navigate to the Explore Logs page and create an alert based on a new or saved query.
    • To create an alert based on a new query, run the query and click the exclamation mark icon in the upper-right corner of the page.

      You can select a time period and use filters for more specific query results. For more information, see Searching for Logs.

    • To create an alert based on a saved query, do the following:
      1. Click the three dots icon in the upper-right corner of the Explore Logs page.
      2. Click Open Saved Query.
      3. Select a saved query of your choice. The query apperas on the Explore Logs page.
      4. Click the exclamation mark icon on the upper-right corner of the page.
  4. Enter a name for the alert.

    You can customize the alert name by including fields in the format ${field_name}. For example, ${hostname}. In the notification title, ${hostname} is replaced with the actual host name value, such as vcenter.

  5. Enter a short meaningful description of the event that triggers the alert.

    You can also customize the alert description using ${field_name}. For example, ${log_type}. In the notification message, ${log_type} is replaced with the actual log type value, for example, audit.

  6. Select or enter a query.
    • You can provide a name for the query and enter a query.
    • Or, select a favorite query from the Favorite Queries drop-down menu.

    You can also select one or more indexed partitions to query logs from the partition.

  7. Define the trigger conditions for the alert and the severity based on each condition.

    You can define the time period to query logs and group logs based on fields such as hostname and app name.

    You can add multiple trigger conditions and set a severity for each trigger condition to Critical, Immediate, Warning, or Info.

    Trigger Condition Description
    On every match
    Note: You can set this trigger condition when you select Real Time in the time period drop-down menu.

    This alert query is matched with every log that is ingested.

    The time period is not relevant.

    Note: Rate limiting is applied to real-time alerts. Alert triggers may get rate limited if there are more than 100 matches per minute for an alert definition.
    When total count of events is applied with operation X for threshold Y

    This alert query is run within the window of the time period. The results are matched with the operation X for the threshold of Y.

    The time period is used to query logs.

    When unique count of field F is applied with operation X for threshold Y

    This alert query is run within the window of the time period. The query returns the unique count of field F. The results are matched with the operation X for the threshold of Y.

    The time period is used to query logs.

    When aggregation operation A on field F is applied with operation X for threshold Y

    This alert query is run within the window of the time period. The query returns the result of the aggregation operation A applied on the field F. The results are matched with the operation X for the threshold of Y.

    The time period is used to query logs.

    Note: Alert evaluation interval is applied for all alerts except real-time alerts. to learn more, see Alert Evaluation Interval.
    1. For each severity, you can choose to send email or webhook notifications in the Choose Notification drop-down menu.
      • To send email notifications, in the Email Recipients text box, enter a recipient email address and click the plus icon.
      • To send webhook notifications, select the check boxes for the webhooks that you want to notify.
      • If VMware Aria Operations for Logs (SaaS) is integrated with VMware Aria Operations (SaaS), select the Send to VMware Aria Operations check box to send notifications to VMware Aria Operations (SaaS).

        If a match is found for any of the trigger conditions, a notification is sent to the VMware Aria Operations (SaaS) objects that caused the alert. When an alert is triggered for windowed alerts (any trigger condition other than Real Time), the triggered alert is forwarded to up to 10 different VMware Aria Operations (SaaS) objects.

        The alert notification appears in the following screens:
        • Alerts > Recent Alerts in VMware Aria Operations for Logs (SaaS)
        • Triggered alerts in VMware Aria Operations (SaaS). When you click the alert, you can view detailed information about the alert and the log.

          You can also browse for the object that caused the alert and view alert details.

        For information about the integration, see Integrating VMware Aria Operations for Logs (SaaS) with VMware Aria Operations (SaaS).

  8. (Optional) Select the time period to pause recurring alerts.

    Activate the Pause Recurring Alerts for a Time Period toggle button and select the time period to pause subsequent alert notifications. The system waits for the selected time period before triggering the next alert that matches the trigger condition.

    If you do not select a time period, the alert window period is selected as the default time period.

    The alert window period is the default pause alert notification period.

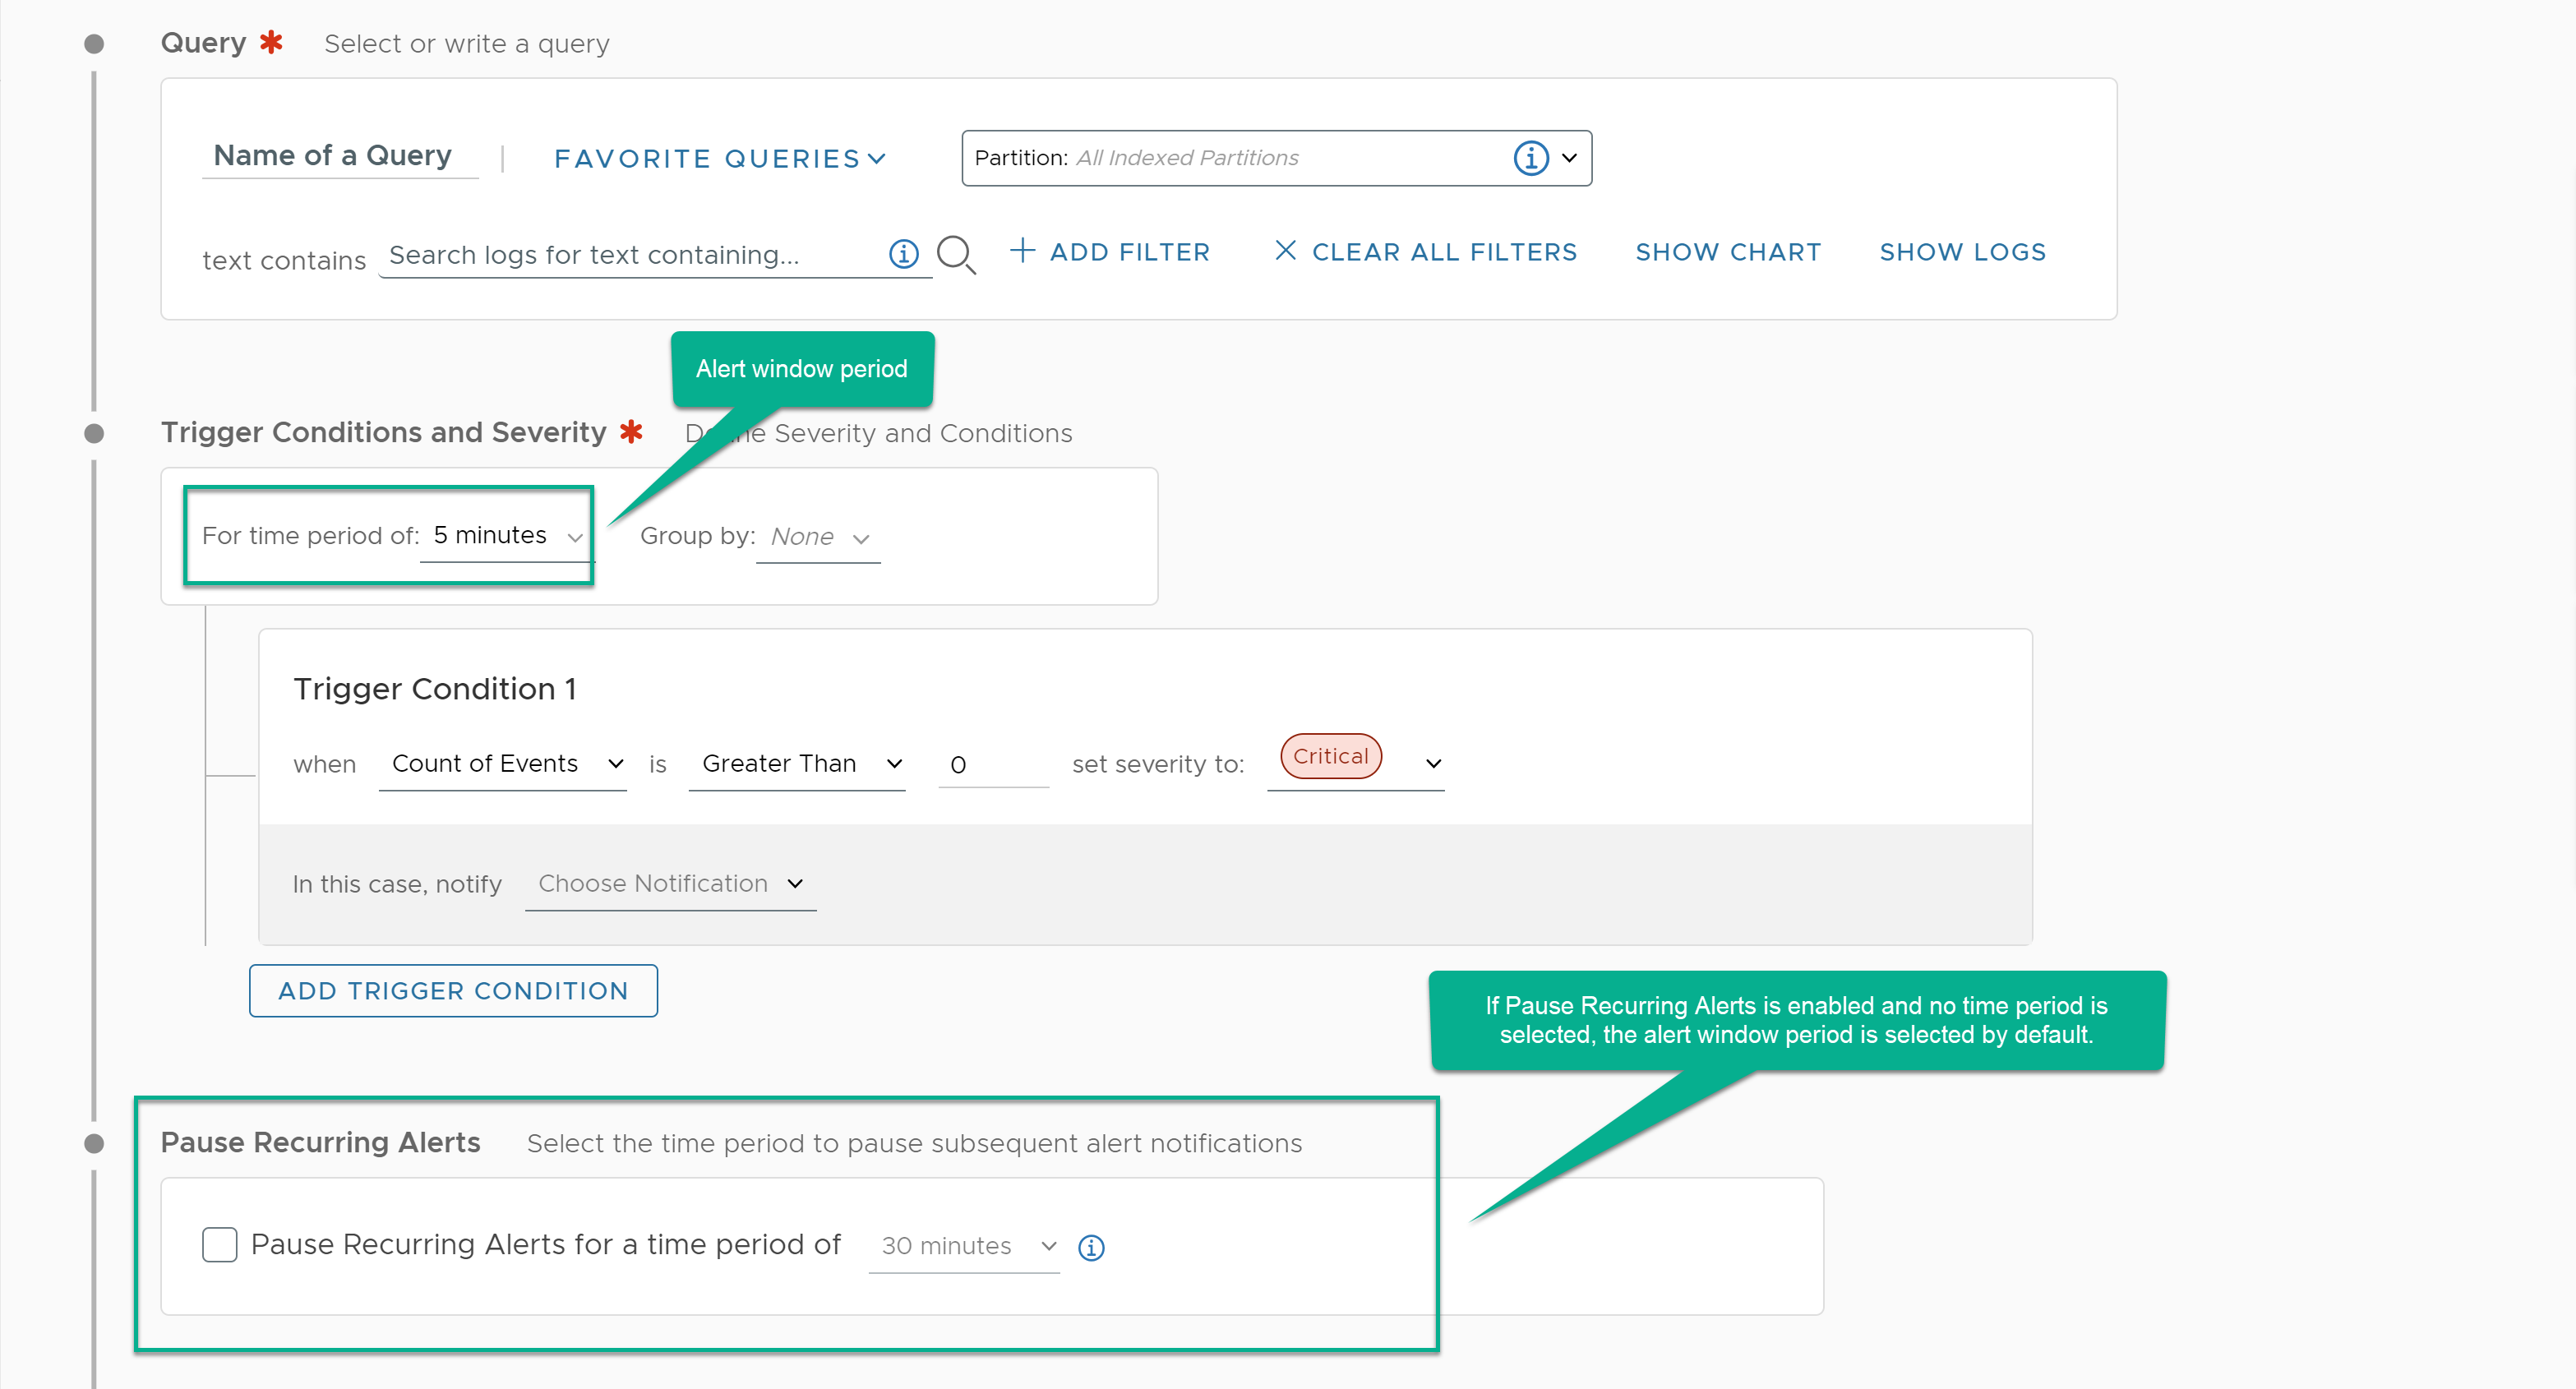
    For example, let us assume that you have selected the alert window period as 6 hours and the Pause Recurring Alerts period as 12 hours. If the alert evaluation starts at 1 PM and the alert criteria matches at 3 PM, an alert notification is triggered by the system. The subsequent alert notification however will only be triggered at 6 AM (after 3 + 12 hours), even if the alert criteria matches during this interval.

  9. (Optional) Enter a recommendation for the alert, which is included in the notification message when the alert is sent.
  10. (Optional) Add one or more tags to the alert.
    You can use existing tags or create new tags. These tags help you group alerts according to your requirement.
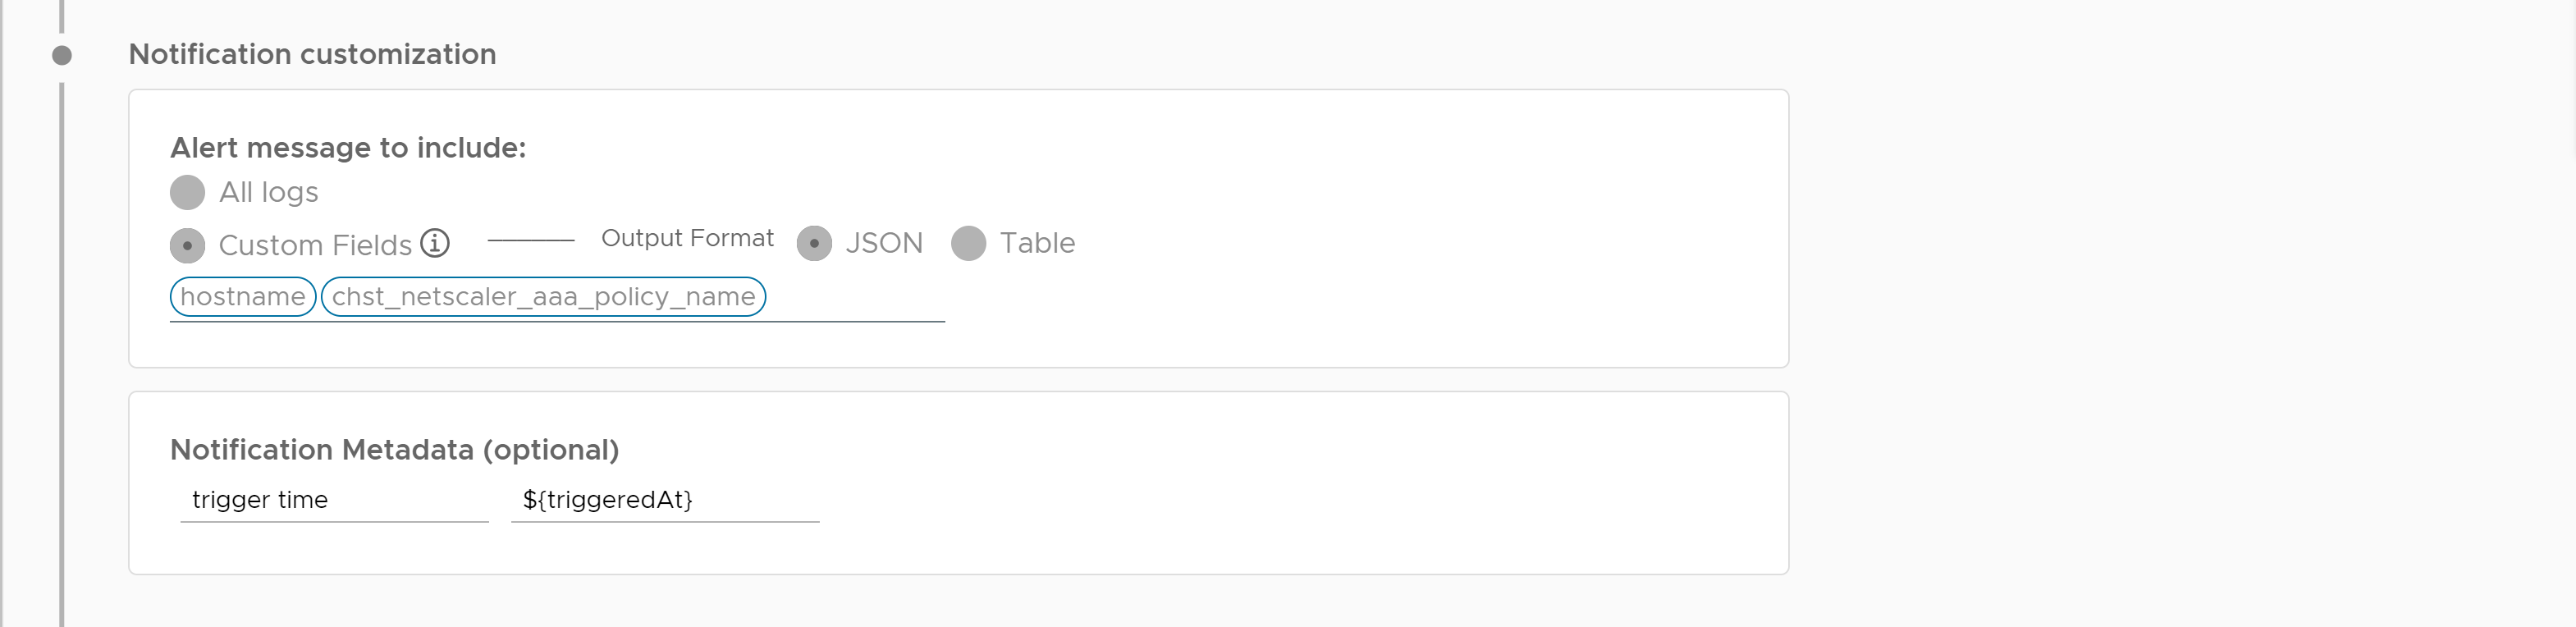
  11. (Optional) Customize your alert notification message.
    Alert Customization Description
    Custom fields

    Select whether you want to include all the logs or custom fields in the name and description of your alert notification message.

    If you choose to include custom fields, enter up to 10 custom fields in the text box.

    To include the custom fields in email notification messages, select a JSON or Table output format.

    Note: To include the custom fields in webhook notification messages, ensure that the ${customFieldsJson} parameter is included in the payload of the selected webhooks. For more information, see Configure a Webhook to Send Alert Notifications.
    Notification metadata Enter a key-value metadata for the email or webhook notifications.

    For example,

    An example of customizing the alert notification while creating alerts.
  12. Click Save.
    Note:

    The alert is deactivated indefinitely by default. To enable the alert, click the toggle button next to the alert name at the top of the page.

Results

The alert definition appears in the Alerts > Alert Definitions page. Alert notifications are sent through email, webhook, or to VMware Aria Operations (SaaS) based on the trigger conditions and severity.