


You can search for and filter log events on the Explore Logs page by entering queries in the search text box.
Procedure
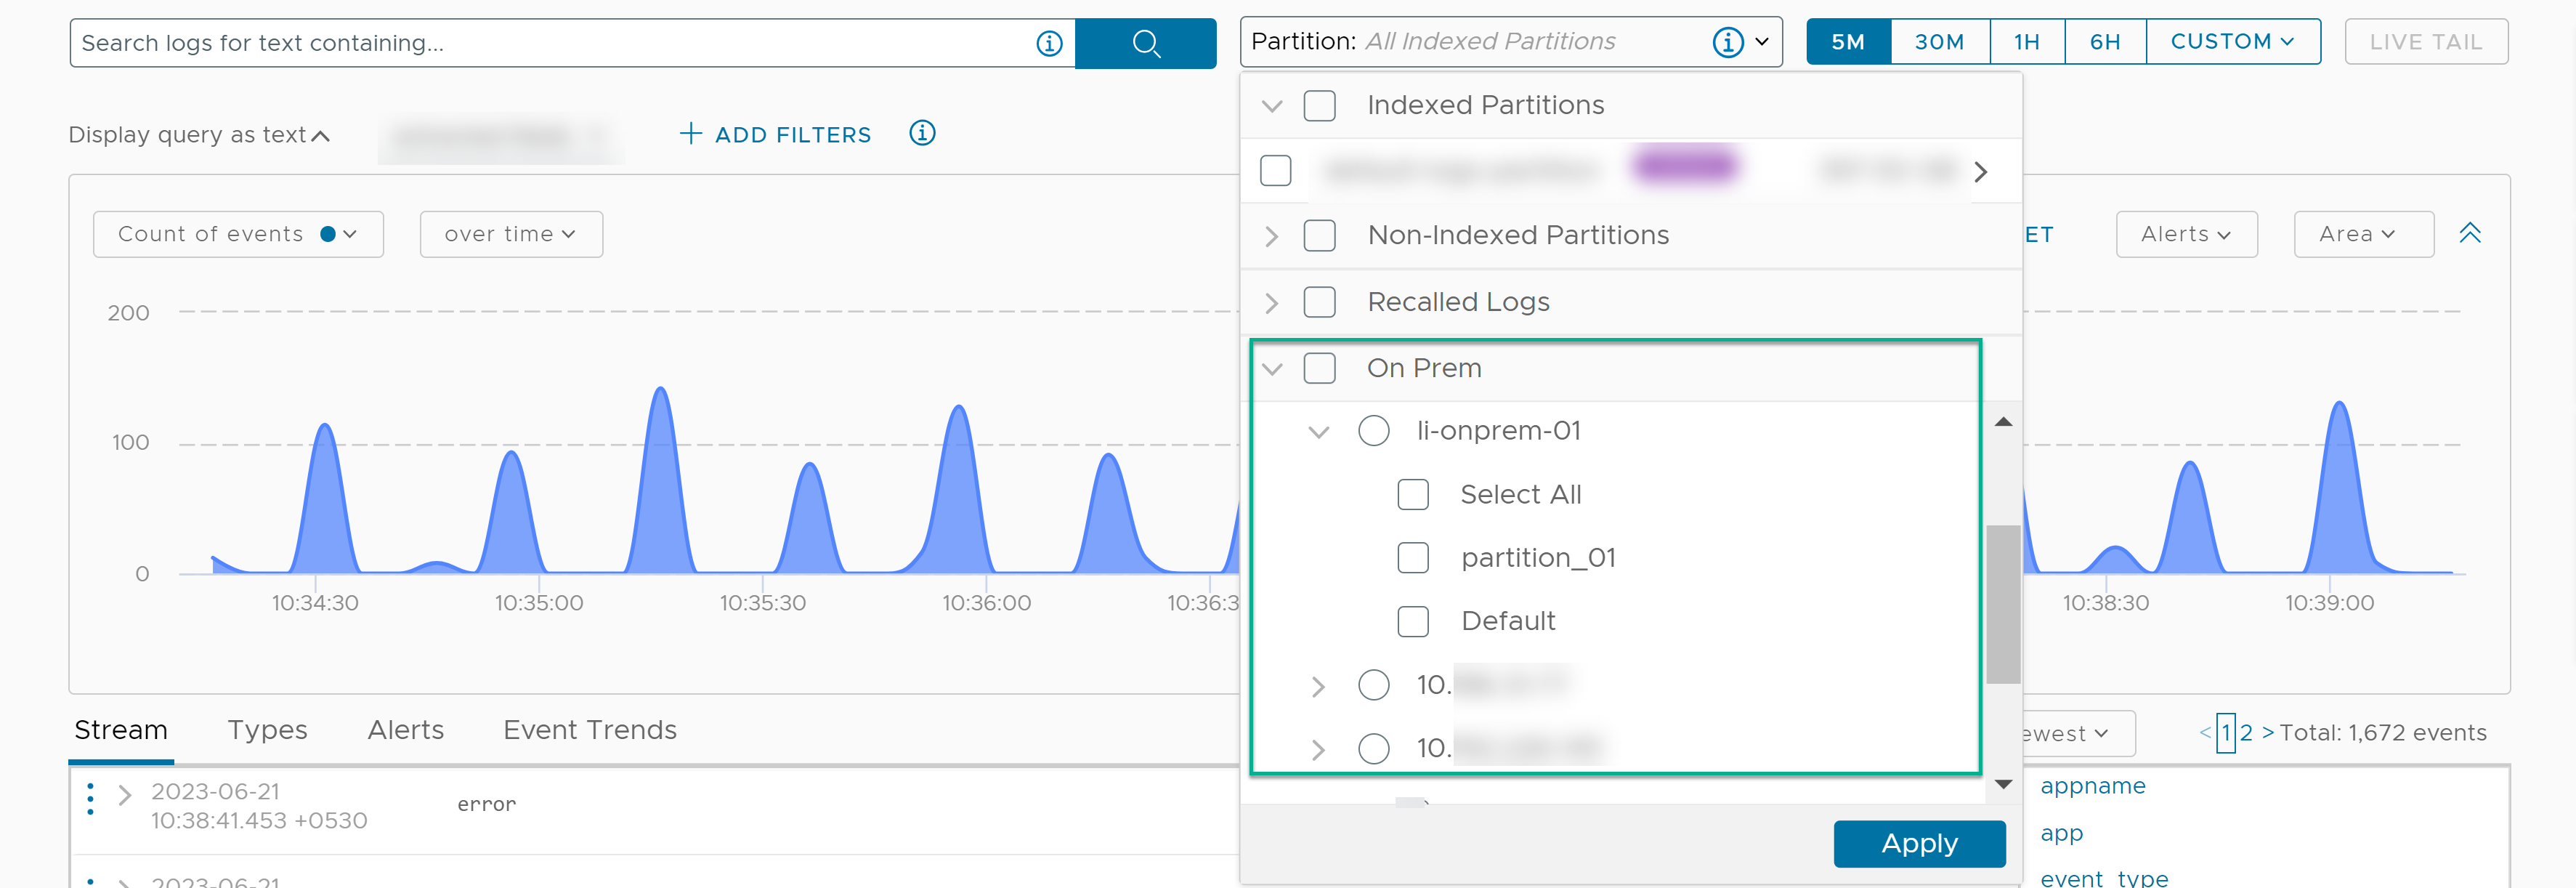
- Select one or more partitions to analyze logs in the partition.
You can select multiple partitions belonging to the same partition type, but you cannot select partitions belonging to different partition types. For example, you can select multiple non-indexed partitions. But you cannot select a recalled logs partition with a non-indexed partition.
Similarly, you can select one or more partitions from a single VMware Aria Operations for Logs cluster. You cannot select partitions belonging to different VMware Aria Operations for Logs clusters.
 For more information, see:
 - Select a time range to find events within the range. Time ranges are inclusive when filtering.
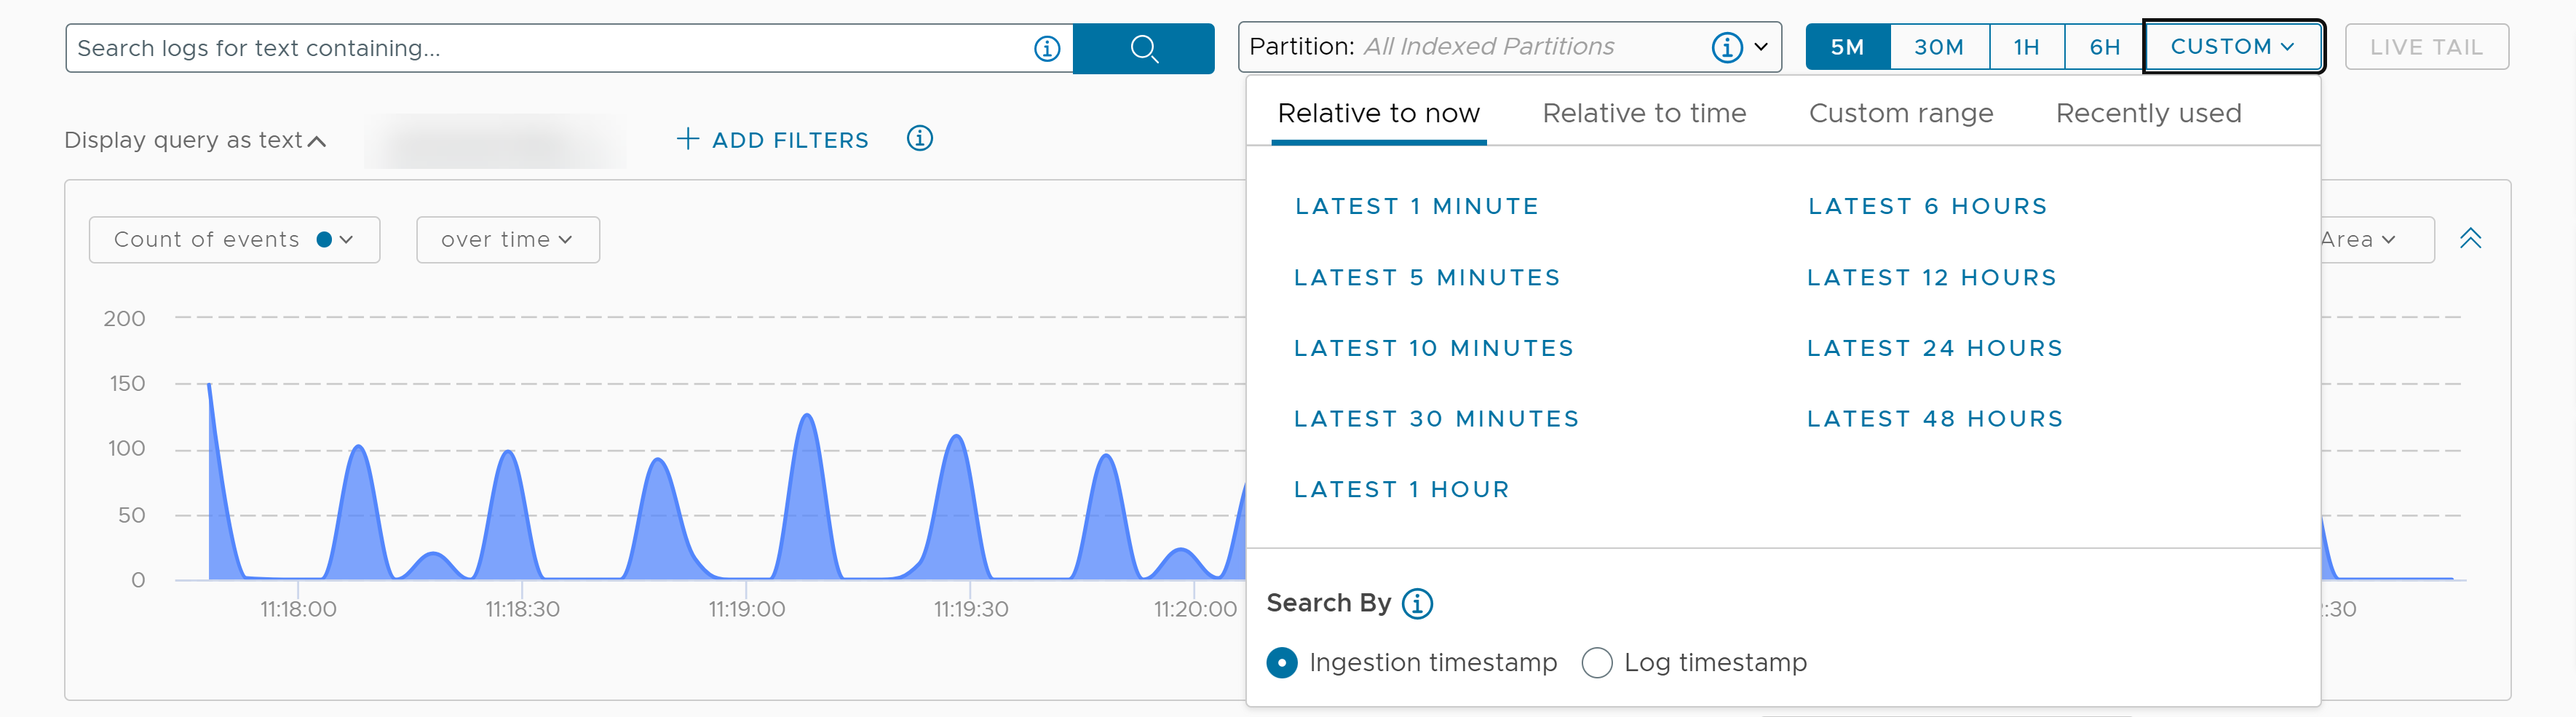
When you pick a time range, click CUSTOM and select either of the following options:
- Ingestion timestamp: This is the default option when you open the Explore Logs page. Selecting this option sets the time range filter based on the timestamp at which each log is ingested into VMware Aria Operations for Logs (SaaS).
For example, the current time is
2023:01:27 09:20:00. If you select Ingested timestamp and a time range of 5M (the last 5 minutes), the search results display logs ingested into VMware Aria Operations for Logs (SaaS) from2023:01:27 09:15:00to2023:01:27 09:20:00. - Log timestamp: Selecting this option sets the time range filter based on the timestamp parsed from the log payload. The log timestamp can differ from the ingestion timestamp, which is the time the log was ingested into VMware Aria Operations for Logs (SaaS).
For example, the current time is
2023:01:27 10:30:00. If you select Log timestamp and the time range as 30M (the last 30 minutes), the search results display logs that contain log timestamp values within the2023:01:27 10:00:00to2023:01:27 10:30:00range.Note: Querying by log timestamp is available only for logs in indexed partitions.
- Ingestion timestamp: This is the default option when you open the Explore Logs page. Selecting this option sets the time range filter based on the timestamp at which each log is ingested into VMware Aria Operations for Logs (SaaS).
