


Active Health Monitors
HTTPS Health Monitor (avinetworks.com)
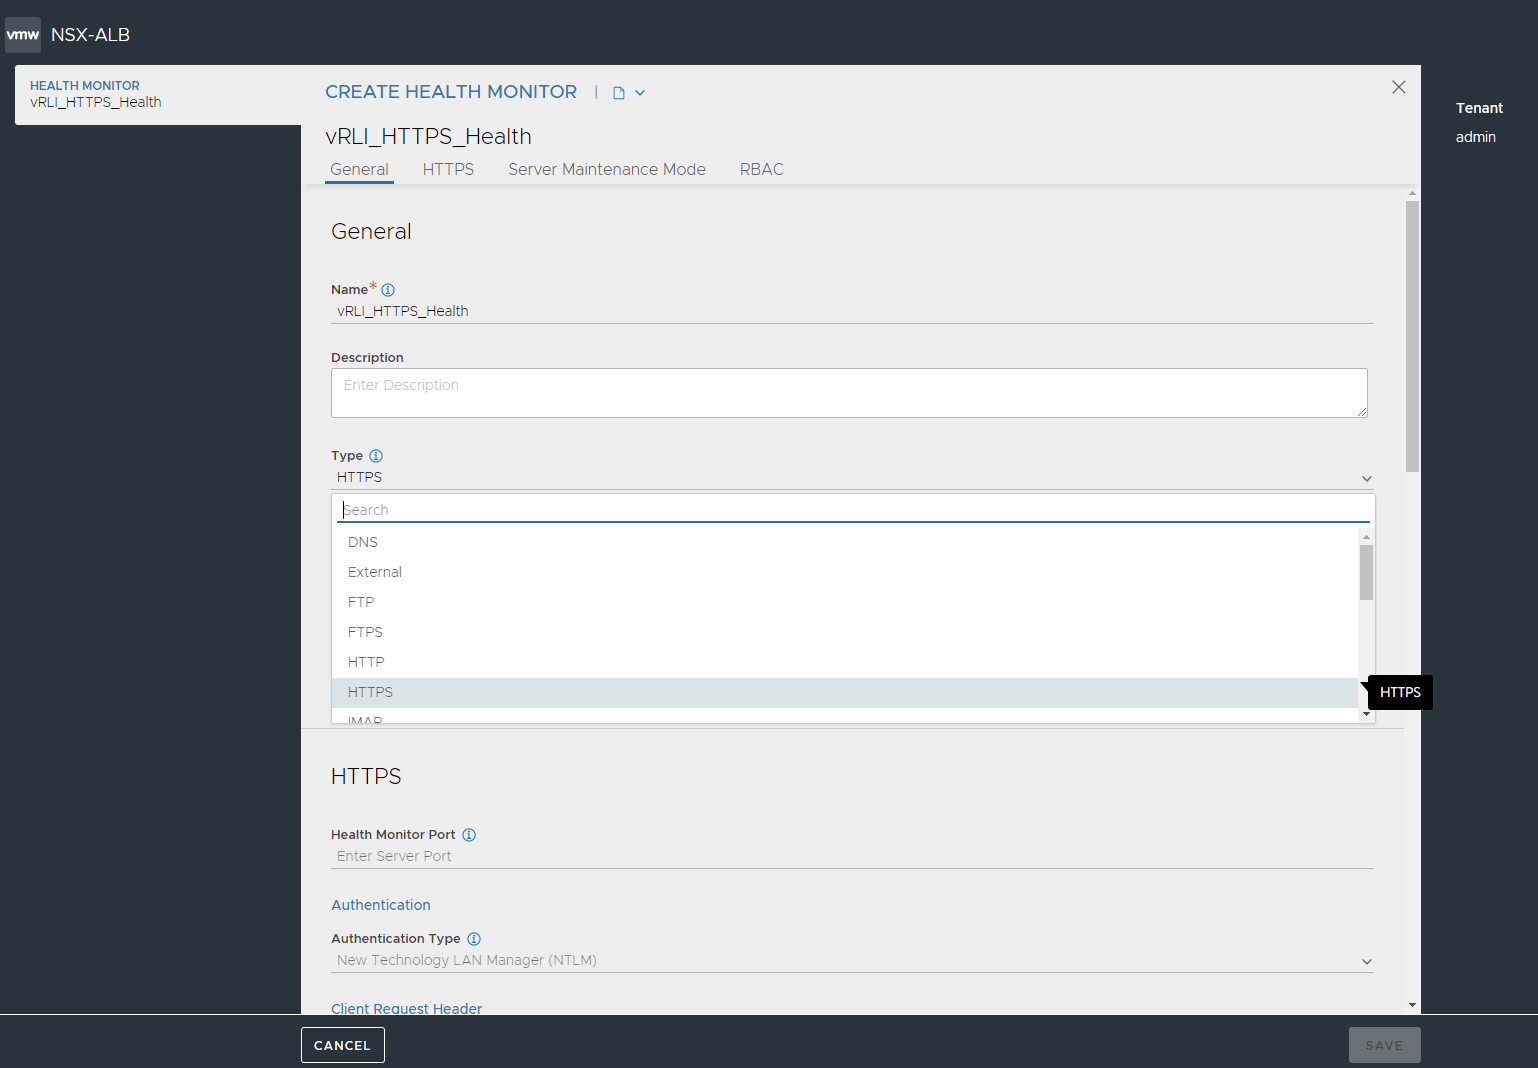
Navigate to Templates → Profiles → Health Monitors → CREATE.
Provide a descriptive name for the health monitor. Example: vRLI_HTTPS_Health
From the "Type" dropdown menu, select "HTTPS" as the type of health monitor.
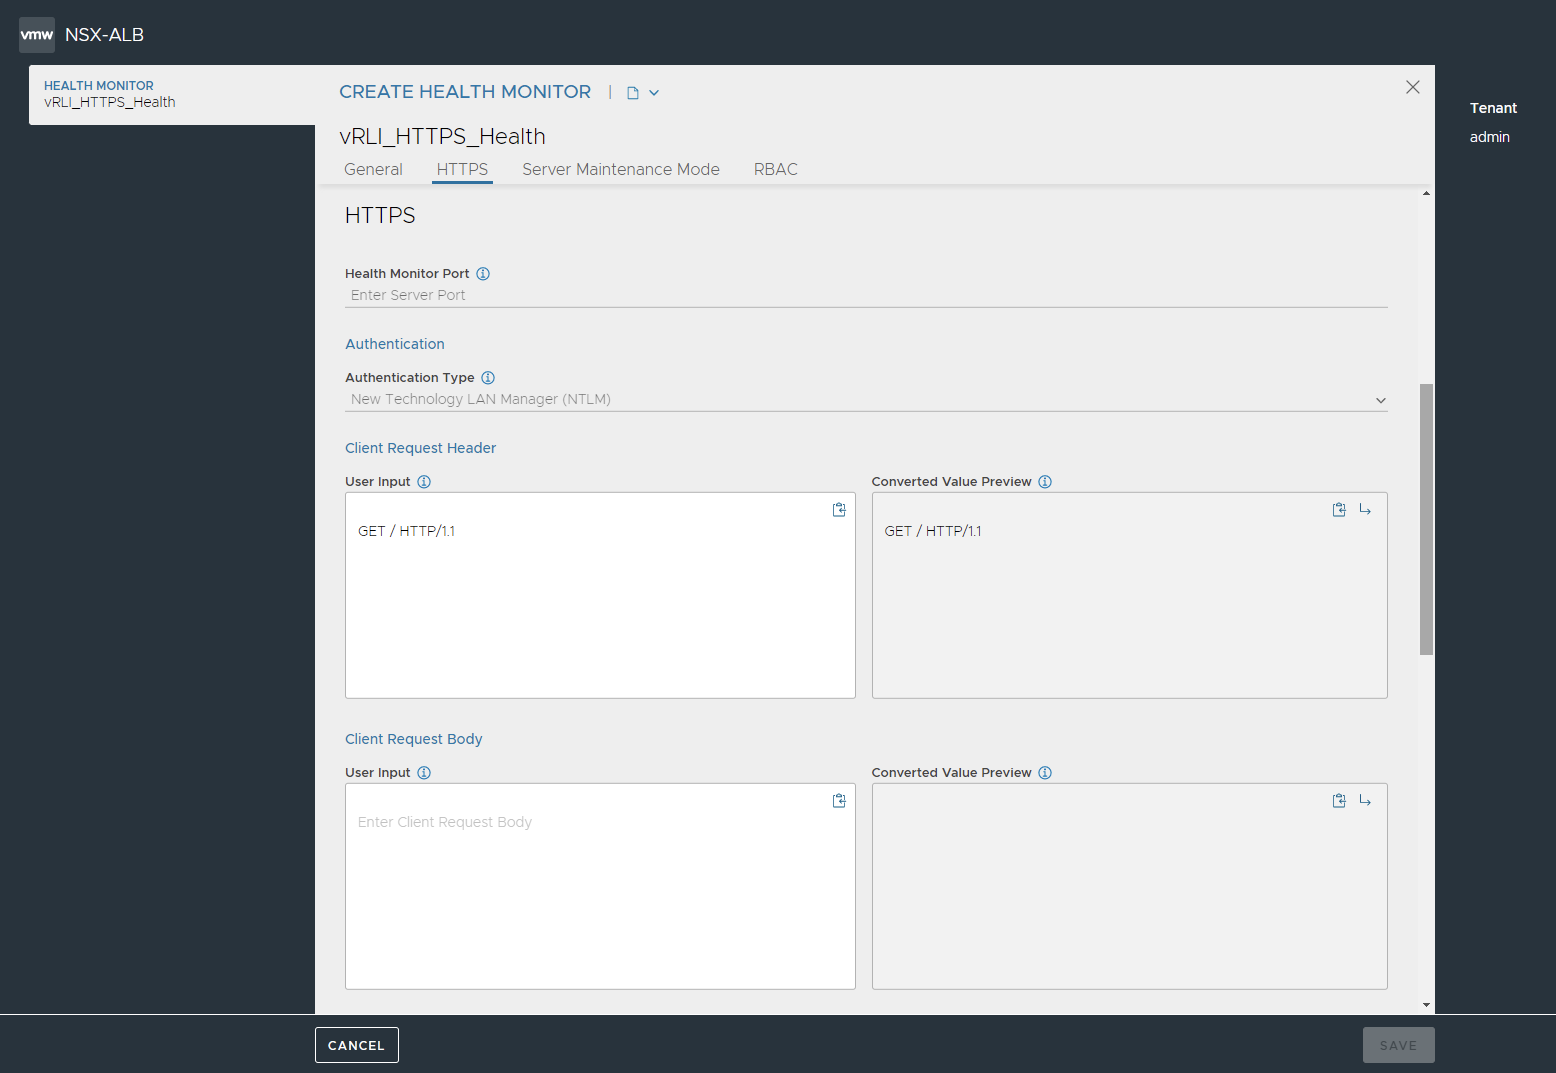
Enter GET / HTTP/1.1 under the Client Request Header as a User Input.
Select 2XX and 3XX from Response Code dropdown.
Check the checkbox for "Enable SSL Attributes" and select "System-Standard" from the "SSL Profile" dropdown.
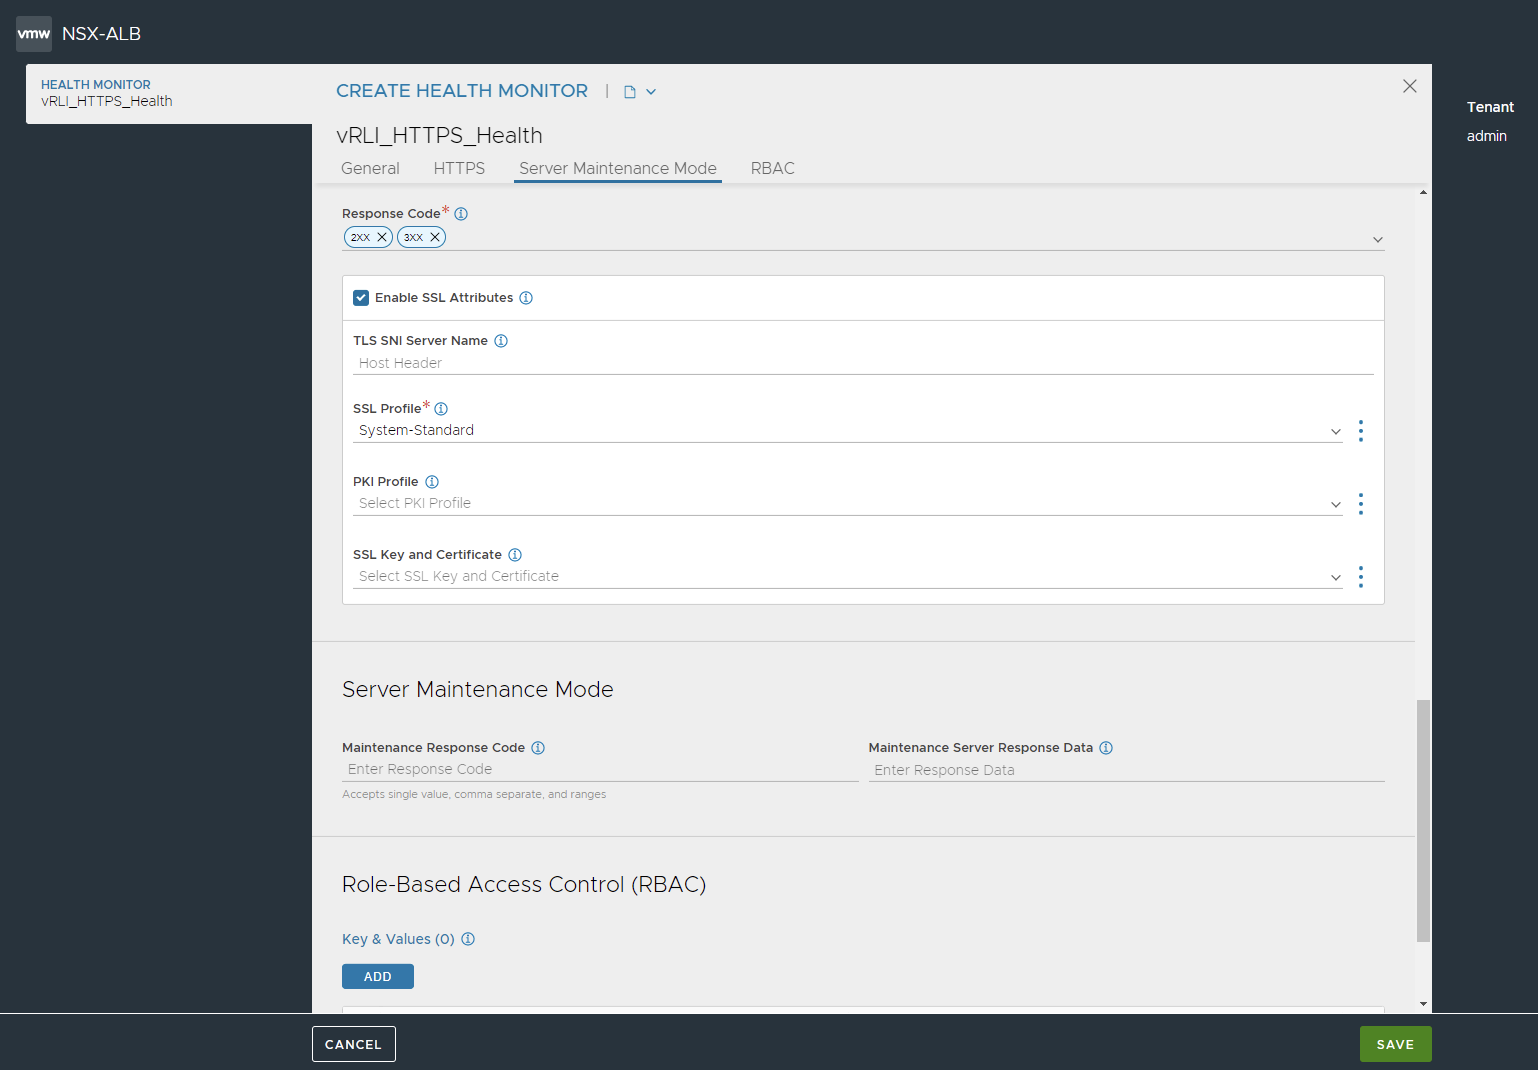
Click SAVE.
UDP Health Monitor (avinetworks.com)
Navigate to Templates → Profiles → Health Monitors → CREATE.
Provide a descriptive name for the health monitor. Example: vRLI_UDP_Health.
From the "Type" dropdown menu, select "UDP" as the type of health monitor.
Enter a request header under the Client Request Header as a User Input. For example: UDPhealth.
The AVI's internal UDP health monitor requires a payload. Means that VMware Aria Operations for Logs will show this payload as a log received from Service Engines.

Click SAVE.
TCP Health Monitor (avinetworks.com)
Navigate to Templates → Profiles → Health Monitors → CREATE.
Enter a name for this health monitor. For example: vRLI_TCP_Health.
From the "Type" dropdown menu, select "TCP" as the type of health monitor.
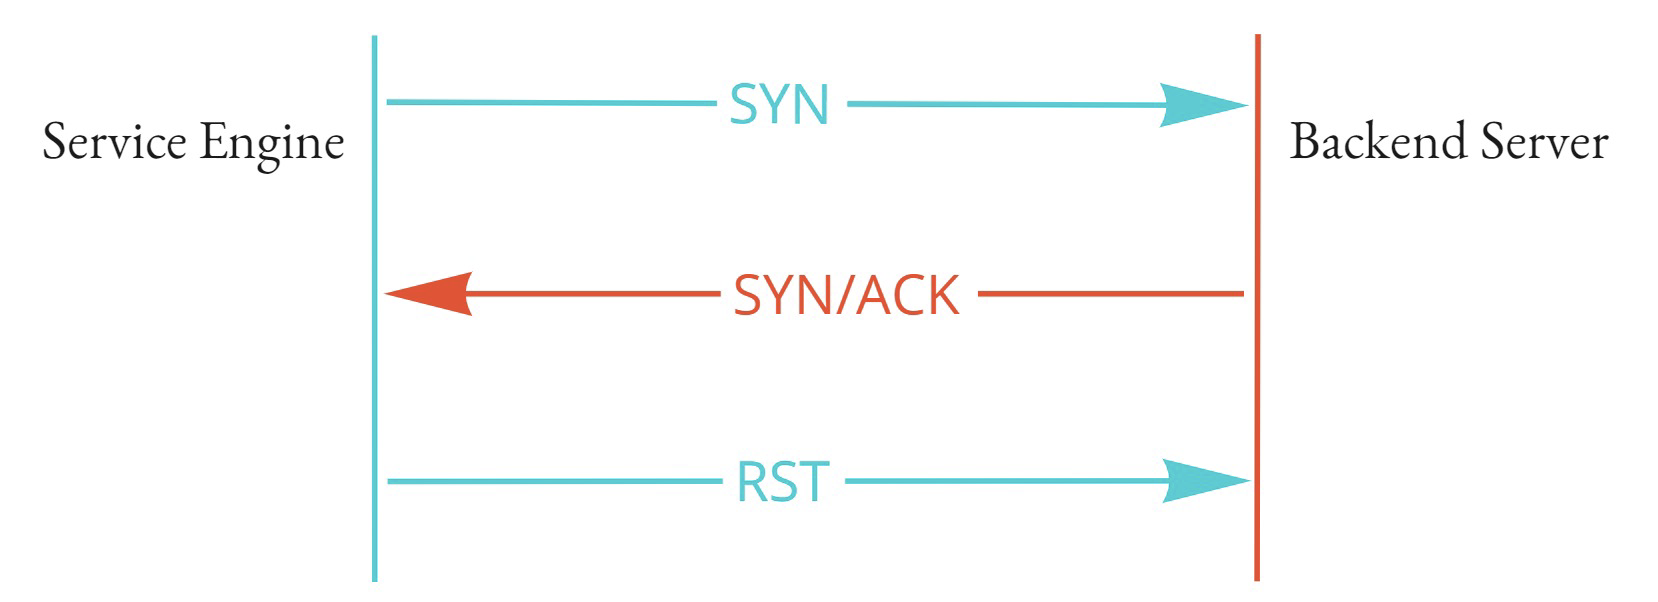
Check the checkbox for Half-Open (Close connection before completion) to monitor the health of backend servers thereby avoiding consumption of a full-fledged serverside connection and the overhead.
This method is light-weight as it makes use of listener in server's kernel layer to measure the health and child socket or user thread is not created on the server side.
Here is how it looks like:
Click SAVE.
