


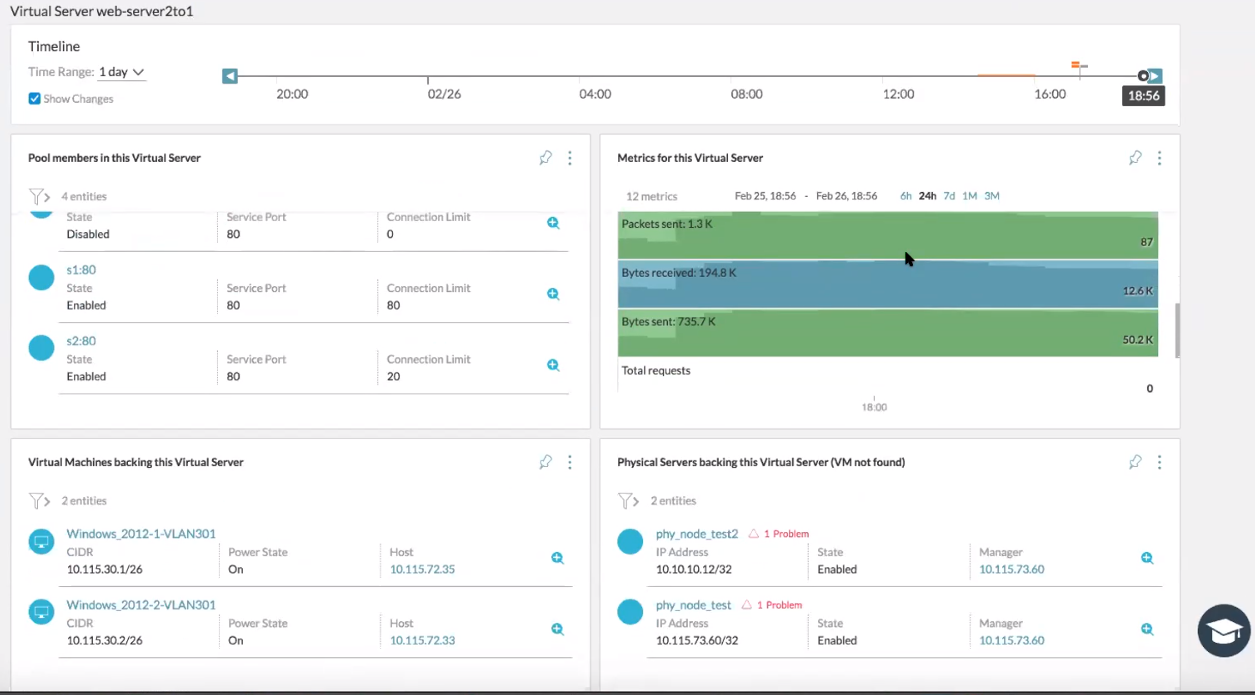
The Virtual Server page displays the virtual server metrics, problems, and change alerts.
You see,
- The list of all pool members in the virtual server and its details, along with an alert for any problem.
- The list of virtual machines
- The list of physical servers
- The list of problem alerts that are associated with the virtual server .
- The list of metrics that are related to the virtual server, such as:
- Connections (count, duration)
- Network metrics (packets and bytes received or sent)
- CPU usage
For the list of supported NSX-V load balancer metrics, see Supported NSX-V Metrics.
- The top flows for the pool members used by the virtual server.
Note: The flow information is not captured for NSX-V load balancer.
- The virtual server properties that provides information about the load balancer IP address, network traffic, service port.
To view the path topology associated with the load balancer, you can use the following query:
client VM name to Virtual server IP.
If there are multiple virtual servers on different service ports, you see the list under the Select a Destination VM section. To see the VM to virtual server path, you can select a server from the list and click Show Path.
To see a set of VMs on the Virtual Server window, you can click the virtual server on the VM path topology and click View Path to see the path from virtual server to the selected VM.
