


The application page provides a complete visibility of an application in VMware Aria Operations for Networks. The application page also allows you to troubleshoot problems and view analytics.
To view the details of an application, from the navigation pane, go to and select an application from the list.
The following table describes different components of the application page:
| Component | Description |
|---|---|
| Overview | You see the overview of the application which includes:
|
| What's New |
|
| Metric | You see the following metrics:
|
| Flows | You see the following traffic flows or flow analytics associated with the application in the last 24 hours:
|
| Microsegmentation | You see:
|
| Intents | You see the following options from the drop-down menu:
|
To start a troubleshooting incident from the application page, click the Troubleshoot button on the top right corner of the application dashboard.
Click More Options next to the Troubleshoot button to modify the application or export to PDF.
Application Topology Map
The application topology map shows the traffic or the flows between the tiers of the same application and between applications. It displays:
- Tier overview
- List of members of the application (VMs, Kubernetes services, and physical IPs).
- Flows between tiers, internet, and shared services.
- The physical IPs that the application depends on or uses.
- Shared services
- Other applications with which this application talks to.
- List of load balancers in the application.
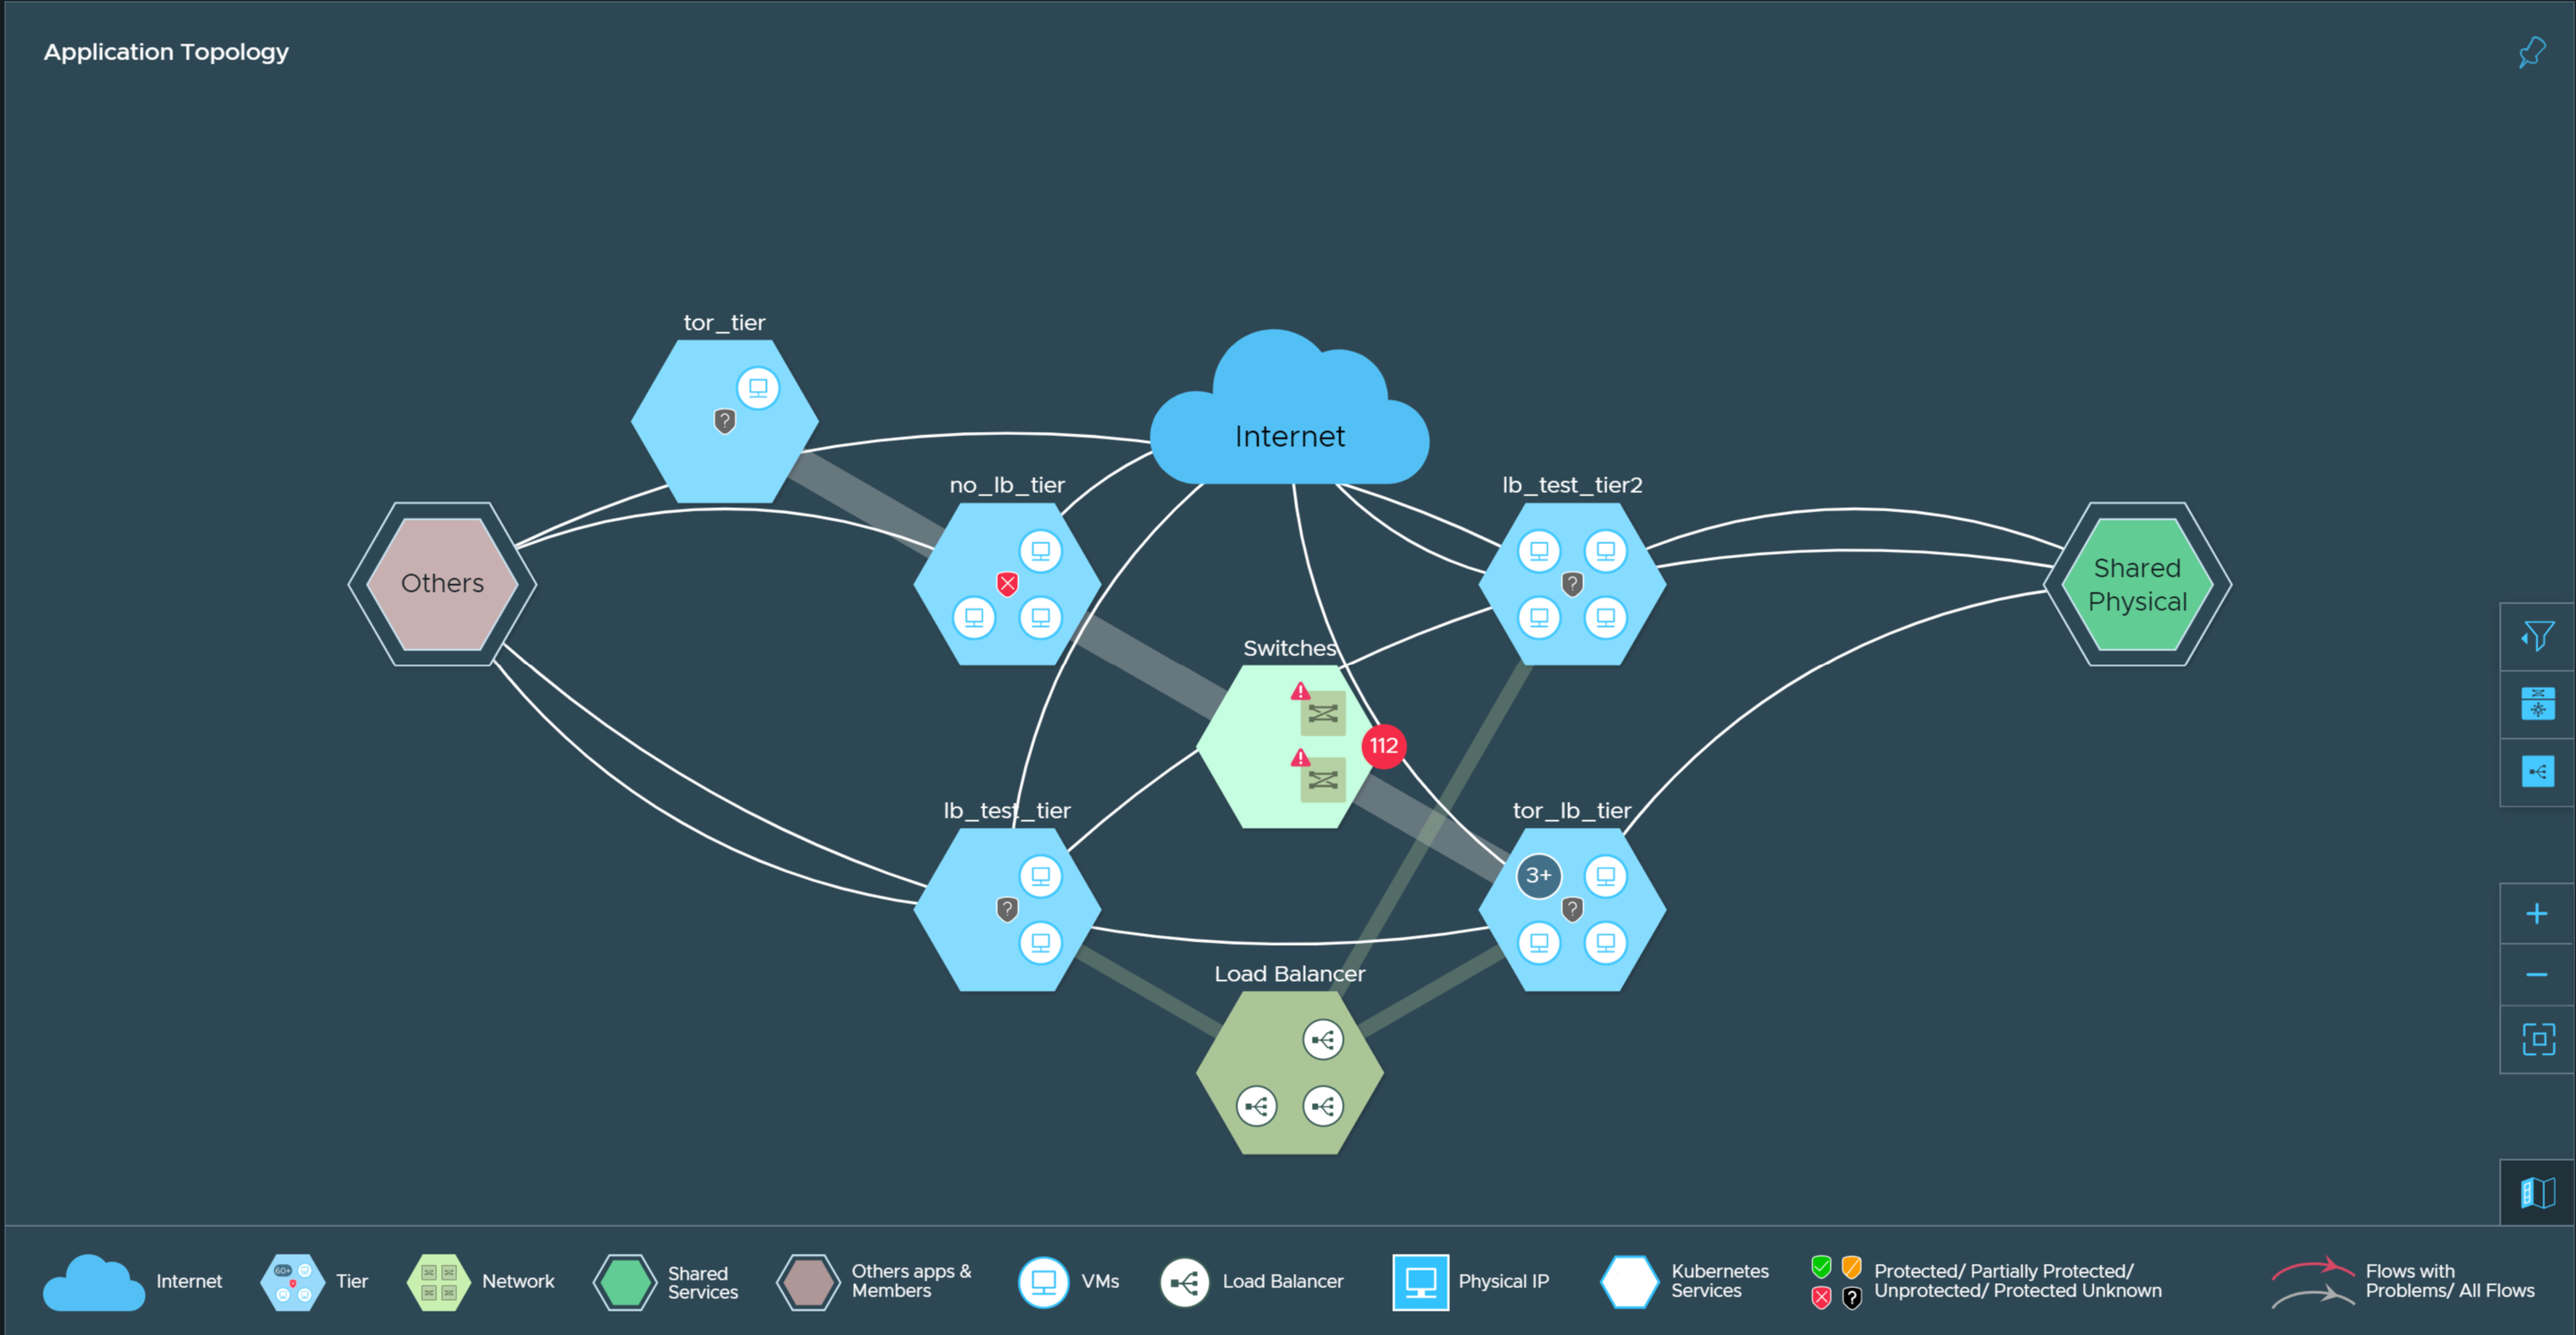
In the application topology map, hexagons represent tiers, load balancers, switches, shared services, and other network entities. You can hover over the hexagon and click View Details to view the details of that network entity.
The thin lines that run between two hexagons represent the flows between those two network entities. You can click anywhere on the flow to view details such as service endpoints of the flows, total traffic of the flow, and so on.
Similarly, if the virtual machines of a tier are configured behind one or more load balancers, you can select the thick lines that runs between the load balancer hexagon and the tier hexagon to view the details of virtual services, pools, and flows that are shared between that tier and the load balancers.
You can click the Pin widget icon at the upper-right corner of the topology map to either pin this topology map to an existing dashboard, or create a dashboard.
You can use the filter and the zoom options at the lower-right corner of the topology map to:
- View all flows, unprotected flows, or only degraded flows in the topology.
- Show or hide the switches associated with the application.
- Show or hide the load balancers associated with the application.
- Zoom in or zoom out of map
- Rearrange the map to fit the current screen
- Show or hide the legend which indicates the representation of each icon in the application topology.
