The Applications page provides an end-to-end visibility of applications in VMware Aria Operations for Networks.
To access the Applications page, from the navigation pane, go to .
On this page, you can:
- View the overall health of applications.
- View applications categorized by different alerts
- Start one or more troubleshooting incidents
- Click the Discover button to perform application discovery
- Click the Add button to add applications manually.

Dashboard Tab
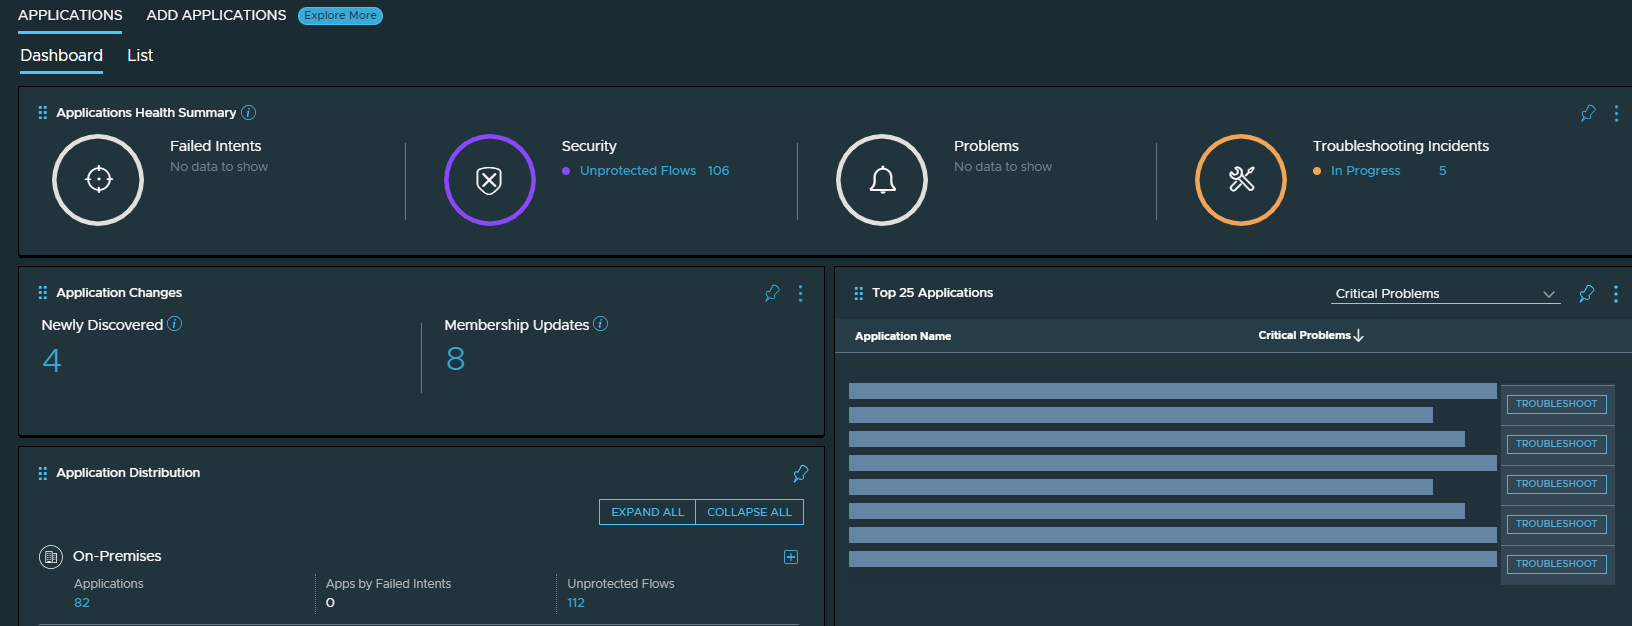
The dashboard tab provides a complete overview of applications in VMware Aria Operations for Networks. The following table describes different elements of the tab:
| Elements | Description |
|---|---|
| Applications Health Summary | Shows applications grouped by alerts, security, failed intents, and troubleshooting incidents. To learn more or troubleshoot issues, click the actionable information within the widget. |
| Application Changes | Shows applications modified in the last 24 hours. You can:
|
| Application Distribution | Shows applications grouped by on-premises, cloud, and hybrid environments. You can expand each section to view details such as failed intents and unprotected flows. |
| Top 25 Applications | Displays the top 25 applications based on:
You can click an application to open the respective application page. If you are viewing the top 25 applications based on critical problems, or intent violations, you can click the Troubleshoot button next to the application to start a troubleshooting incident. |
List Tab
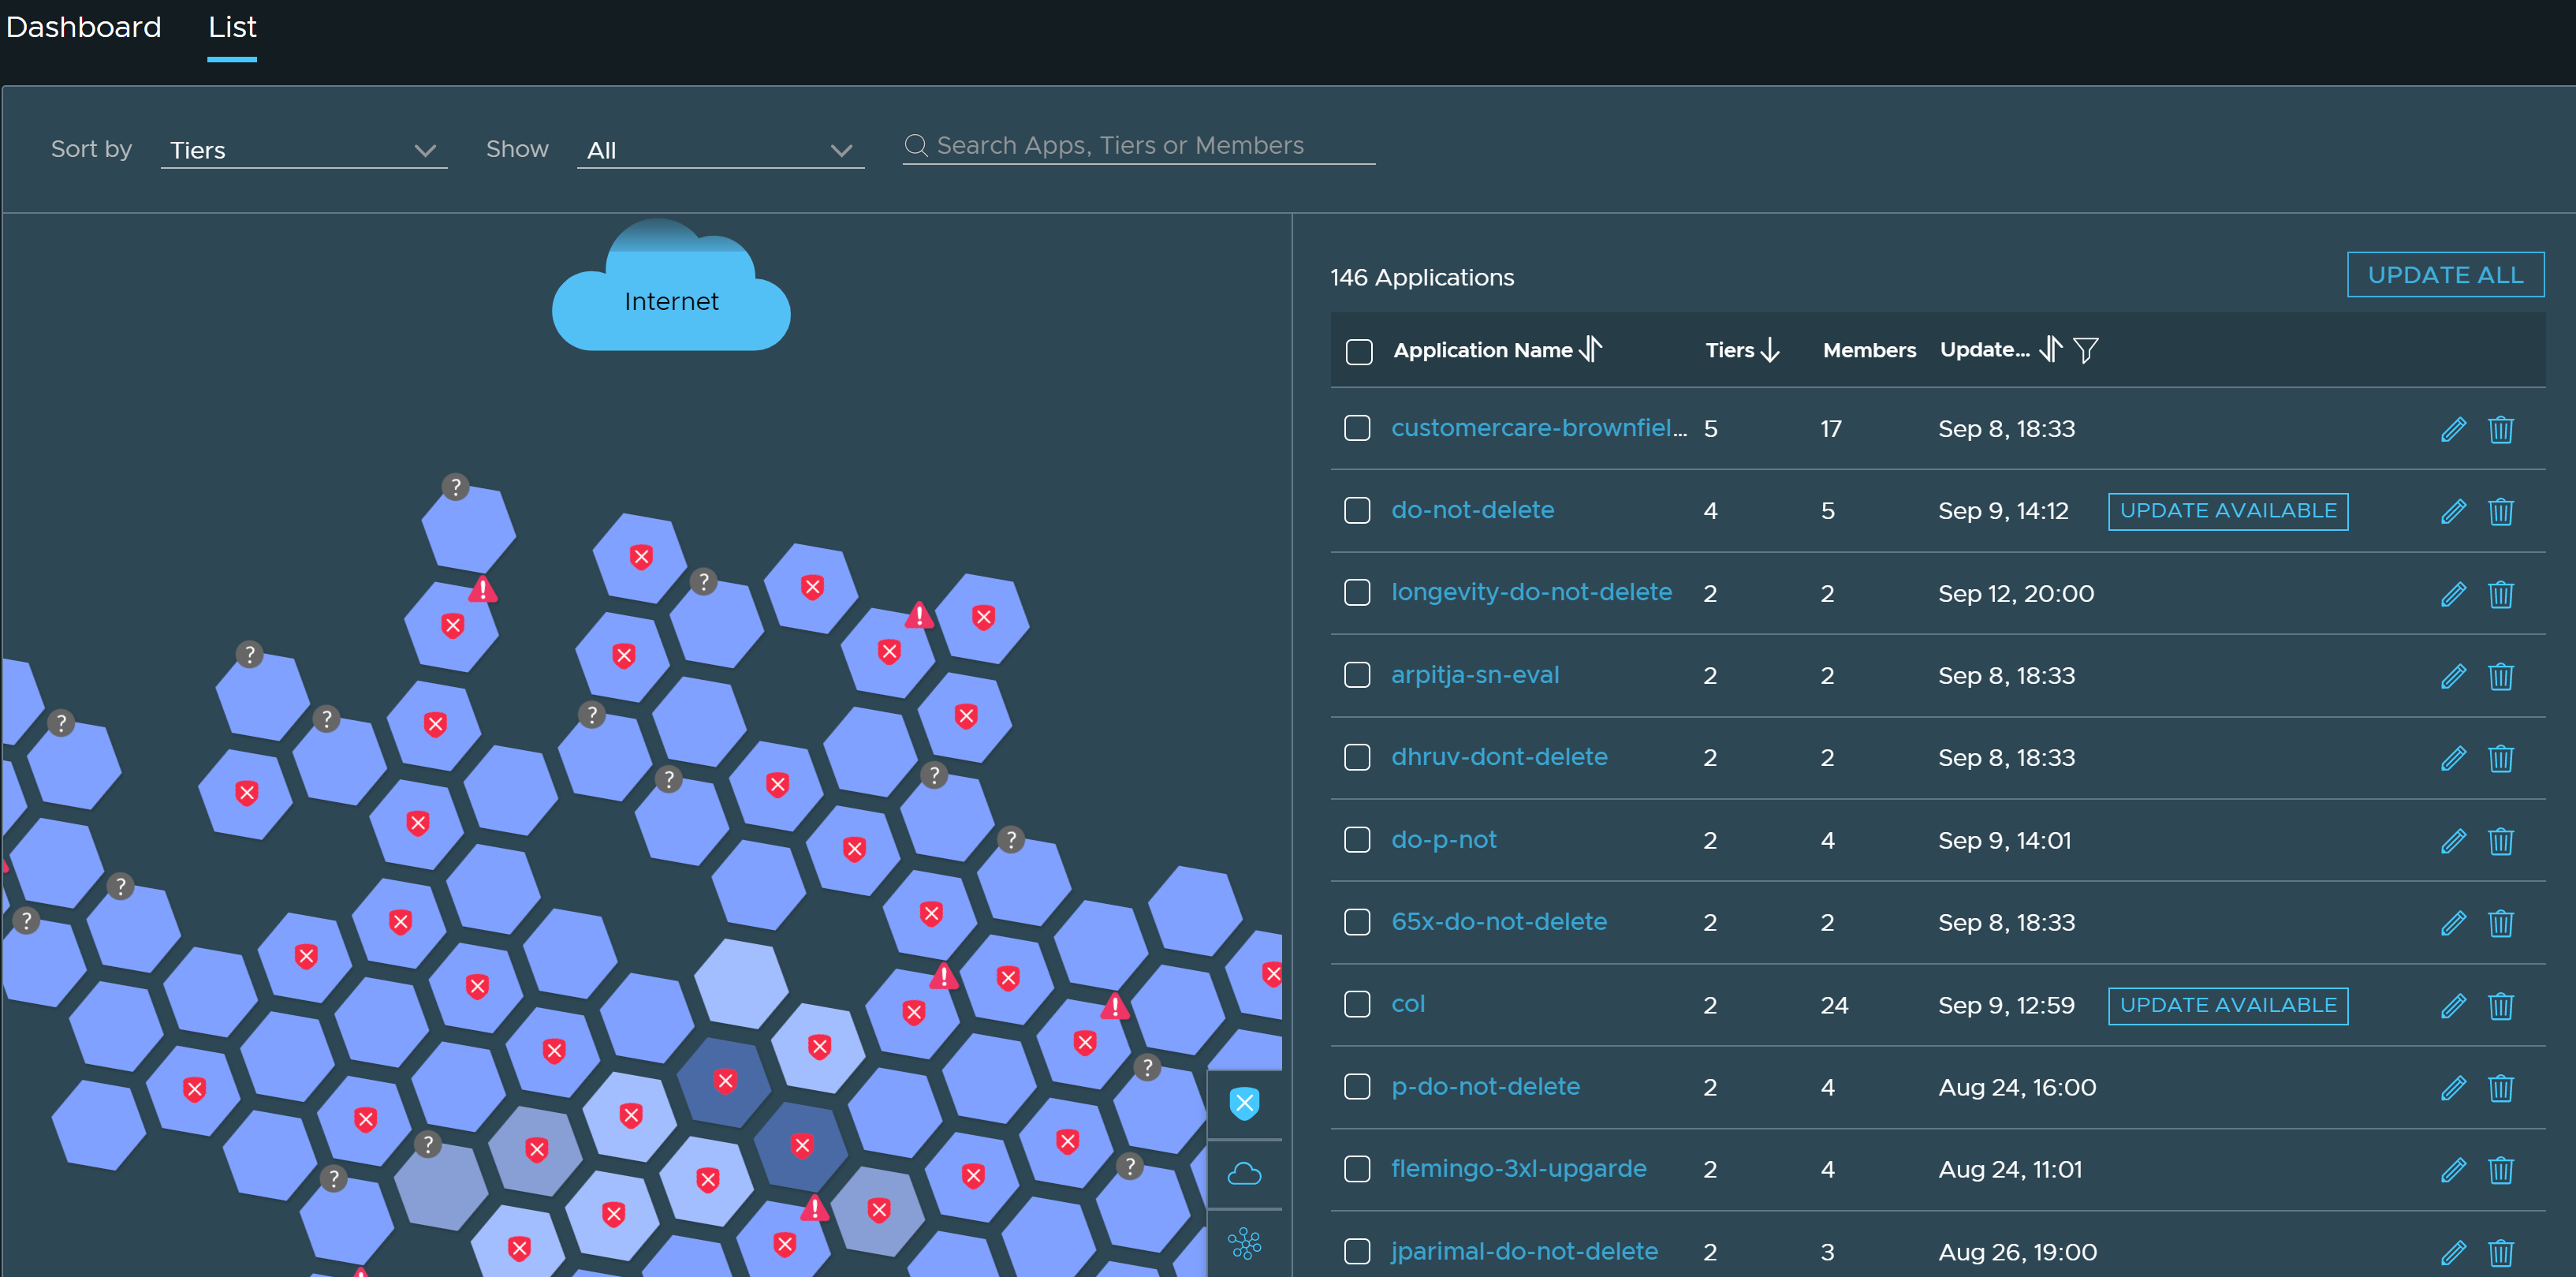
The list tab displays applications in a table and a map view.

The map and the tabular view are interactive. If you click an application in the tabular view, the hexagon representing the application gets highlighted or focused on the map view, displaying shared services and network connections with other applications.
| View | Description |
|---|---|
| Table | The tabular view displays details such as application name, count of members, count of tiers and updated at. You can do the following:
|
| Map | On the map view, you can:
Note: If there are no flows or members associated with the application, a question mark is displayed on the hexagon.
|