


Once you have added a threshold configuration, you can view its details on the Threshold Configuration page.
Procedure
- On the left navigation pane, click Analytics. Click Thresholds.
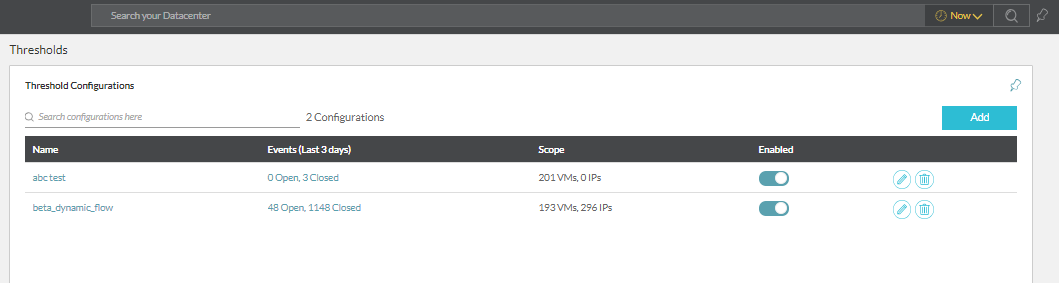
- Click the desired threshold configuration from the list to view the dashboard for that particular configuration.
You can view the following widgets on the dashboard: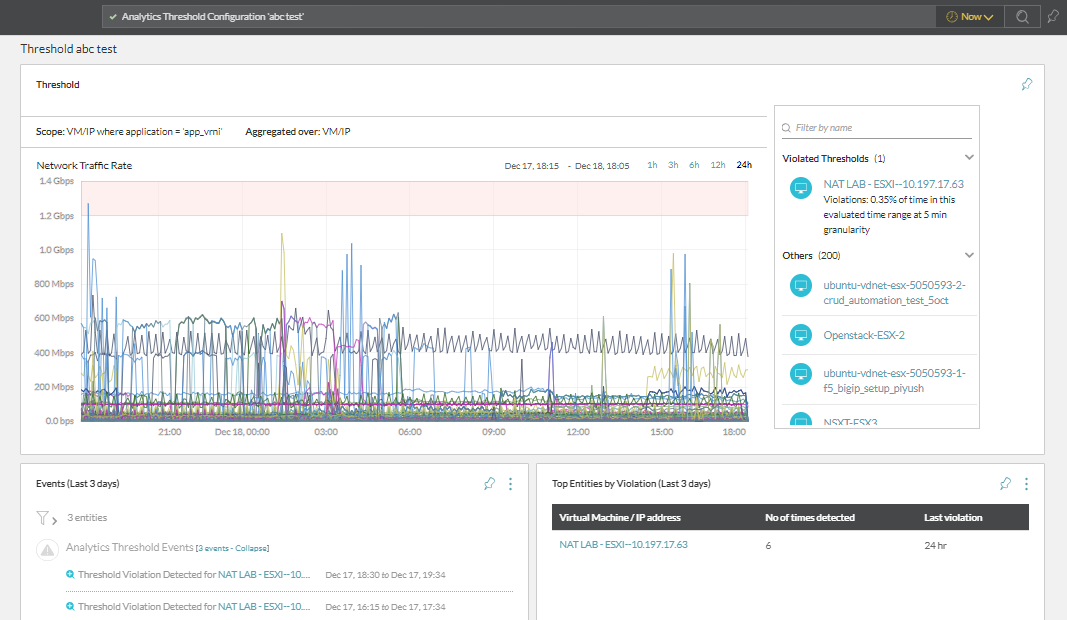
- Graph: The threshold graph helps you detect the entities that have violated the thresholds.
- Alerts: This widget provides the list of alerts that have been generated for violated thresholds for the last three days.
- Top Entities by Violation: This widget lets you know the top entities that have been the cause of aberrations for the last three days.
