


The homepage enables you to create, view, and manage dashboards in VMware Aria Operations for Networks.
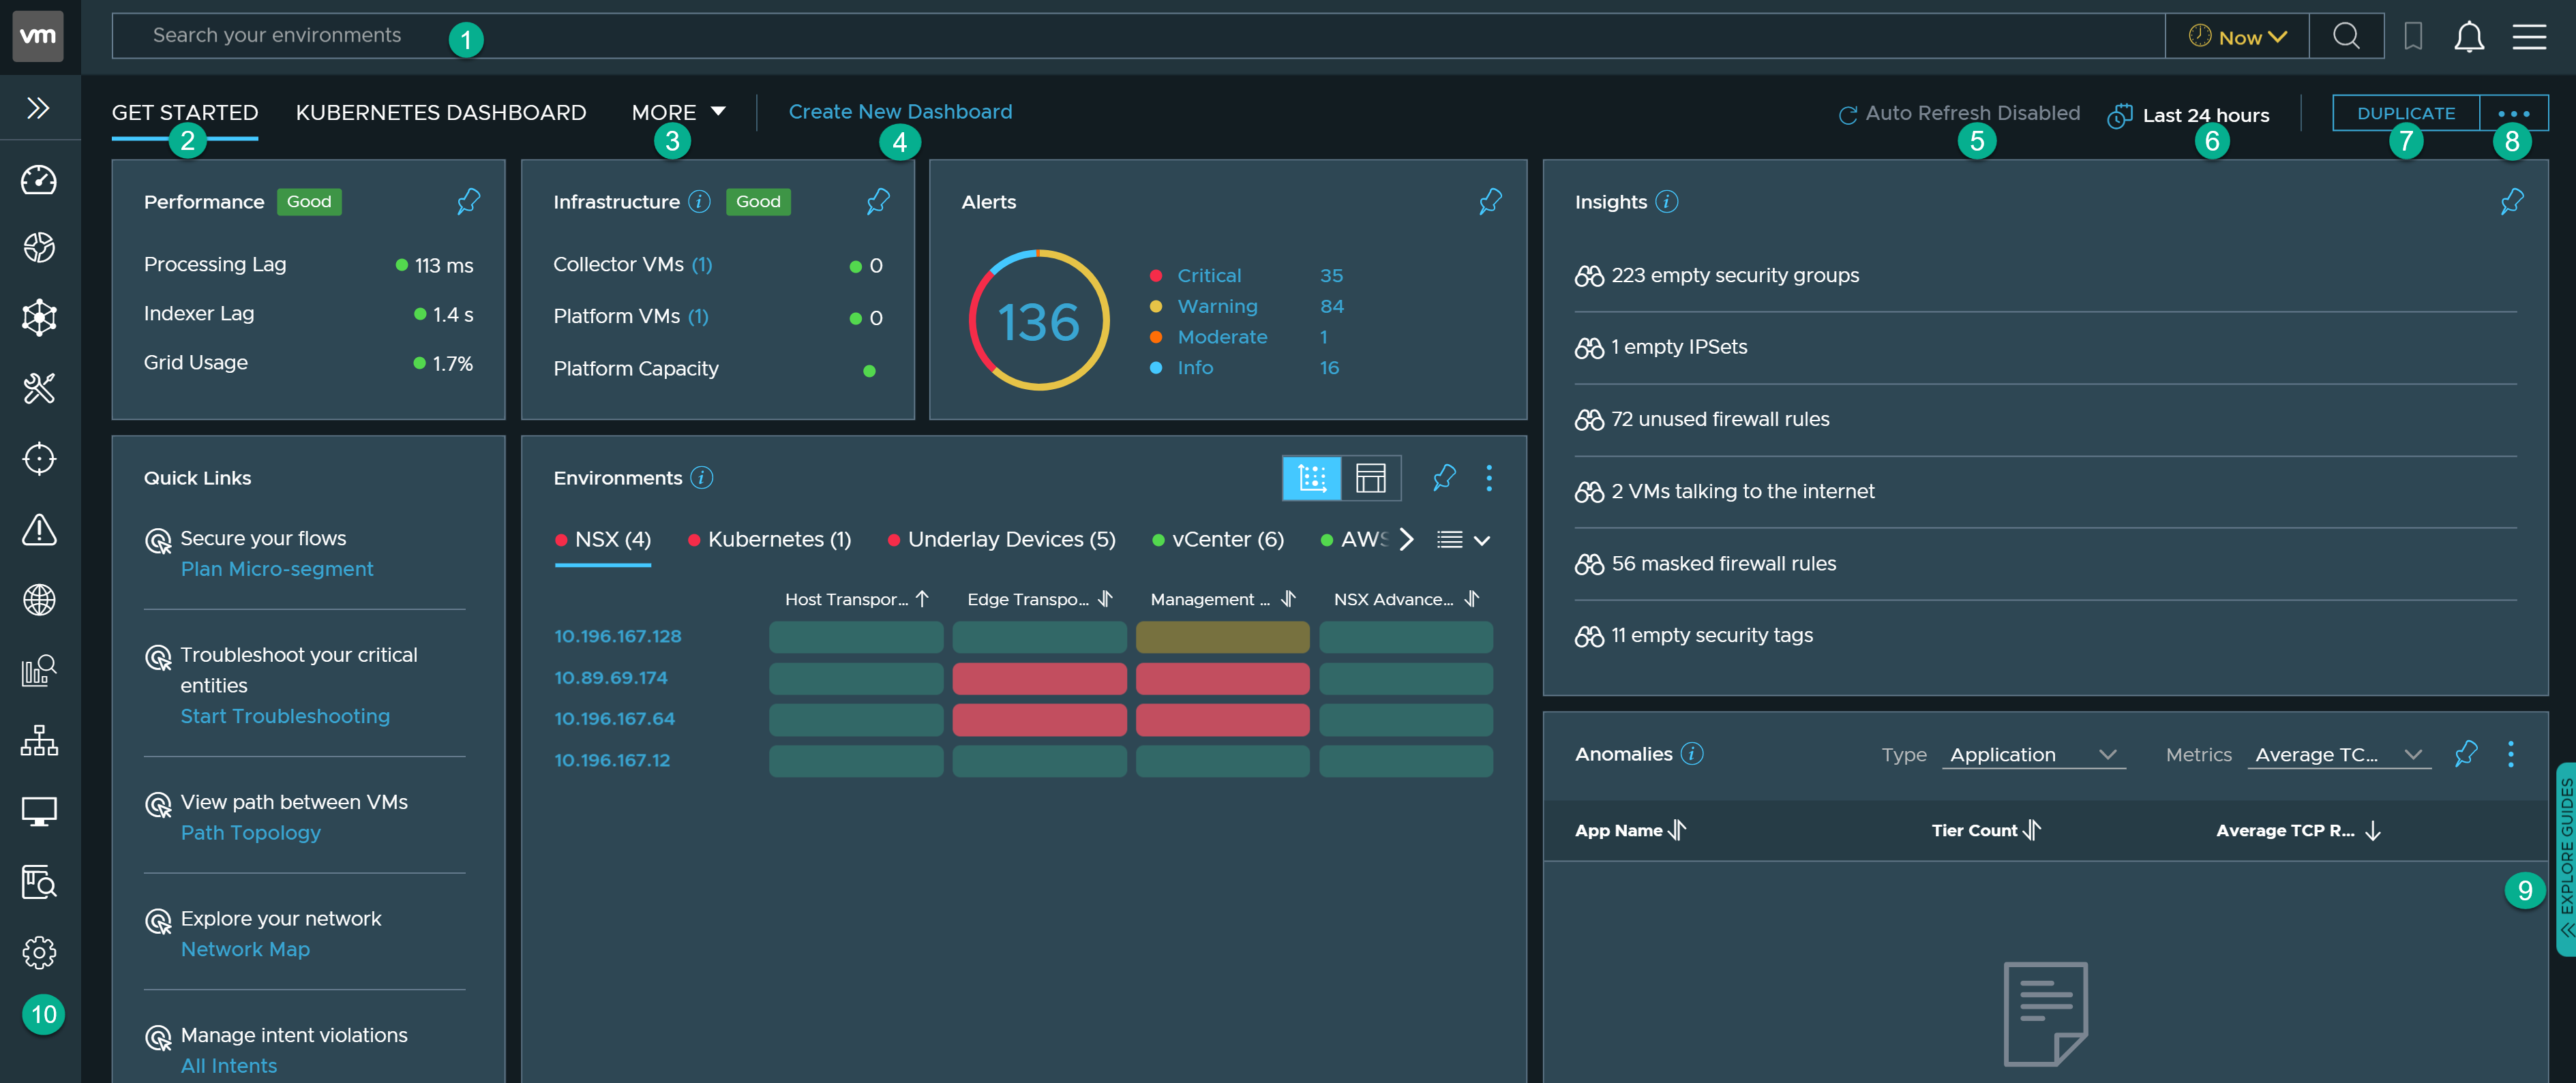
The homepage contains several elements:
| Elements | Description |
|---|---|
| Search bar (1) | Enables you to search across your entire data center network and its corresponding entities. Based on your requirement, you can perform search as per the following time line options:
|
| Get Started (2) | Provides a high-level overview of your entire data center. The Get Started dashboard is available by default on the VMware Aria Operations for Networks homepage. |
| More (3) | If you have more than one dashboard, the More drop-down menu is displayed. This drop-down menu enables you to manage dashboards and arrange the order in which the dashboards are displayed on the homepage.
Note: You can display a minimum of one dashboard and a maximum of five dashboards on the homepage.
|
| Create New Dashboard (4) | Enables you to create a new dashboard and access it from the homepage. |
| Auto Refresh (5) | Enables you to change the auto refresh time frame at a global level. |
| Last 24 hours (6) | Displays the dashboard data for the last 24 hours from the current time. Based on your requirement, you can view the dashboard data as per the following time line options:
|
| Duplicate (7) | Enables you to duplicate the selected dashboard.
Note: You cannot duplicate dashboards such as Kubernetes, and SD-WAN.
|
| More options (8) | Enables you to edit, share, delete, and download the selected dashboard as PDF.
Note: The options differ based on the dashboard you are accessing. For example, you cannot share or delete
Get Started, Kubernetes, and SD-WAN dashboards.
|
| Explore Guides (9) | Shows guided workflows to perform some of the most important tasks in VMware Aria Operations for Networks. |
| Navigation pane (10) | Enables you to access key product features such as Plan & Assess, Intent, and Entities without having to type a search query. |
The Get Started Dashboard
The Get Started dashboard is a system-defined dashboard that provides a high-level overview of what is happening in your entire data center. It also provides quick access to the important components of your data center.
The dashboard contains several widgets such as:
| Widgets | Description |
|---|---|
| Performance | Indicates the health of platform VMs, collector VMs, and the platform capacity. |
| Infrastructure | Displays the platform capacity. |
| Alerts | Displays the alerts sorted by the severity. |
| Insights | Highlights critical or behavioral changes in the network at the current time. This section also highlights entities such as applications, firewall rules, and VMs that need immediate attention. |
| Quick Links | Shows useful quick links. |
| Environments | Shows a heat map view indicating the health of entities associated with each environment type. |
| Anomalies | Shows error metrics for applications, VMs, and VMware NSX-T Edge Transport nodes. |
Note: You cannot share, edit, or delete the
Get Started dashboard. However, you can duplicate the dashboard and save the dashboard as a PDF file.
