


When VMware Aria Operations is integrated with VMware Aria Operations for Logs, you can search for log messages in context, and collect and analyze log feeds from within . You can view log-related metrics for troubleshooting. You can also dynamically extract fields from log messages based on customized queries.
Log Analysis
- From the left the menu, select .
- By selecting an inventory object from the left pane of the page, and clicking the Logs tab.
You can also create a dashboard which displays the log analysis screen.
For more details on how to integrate with VMware Aria Operations for Logs, see the topic, Configuring VMware Aria Operations for Logs with VMware Aria Operations
The Log Analysis Screen
The log analysis screen in the log analysis page, the logs tab of an object, and dashboards looks like the image below after you integrate with VMware Aria Operations for Logs:
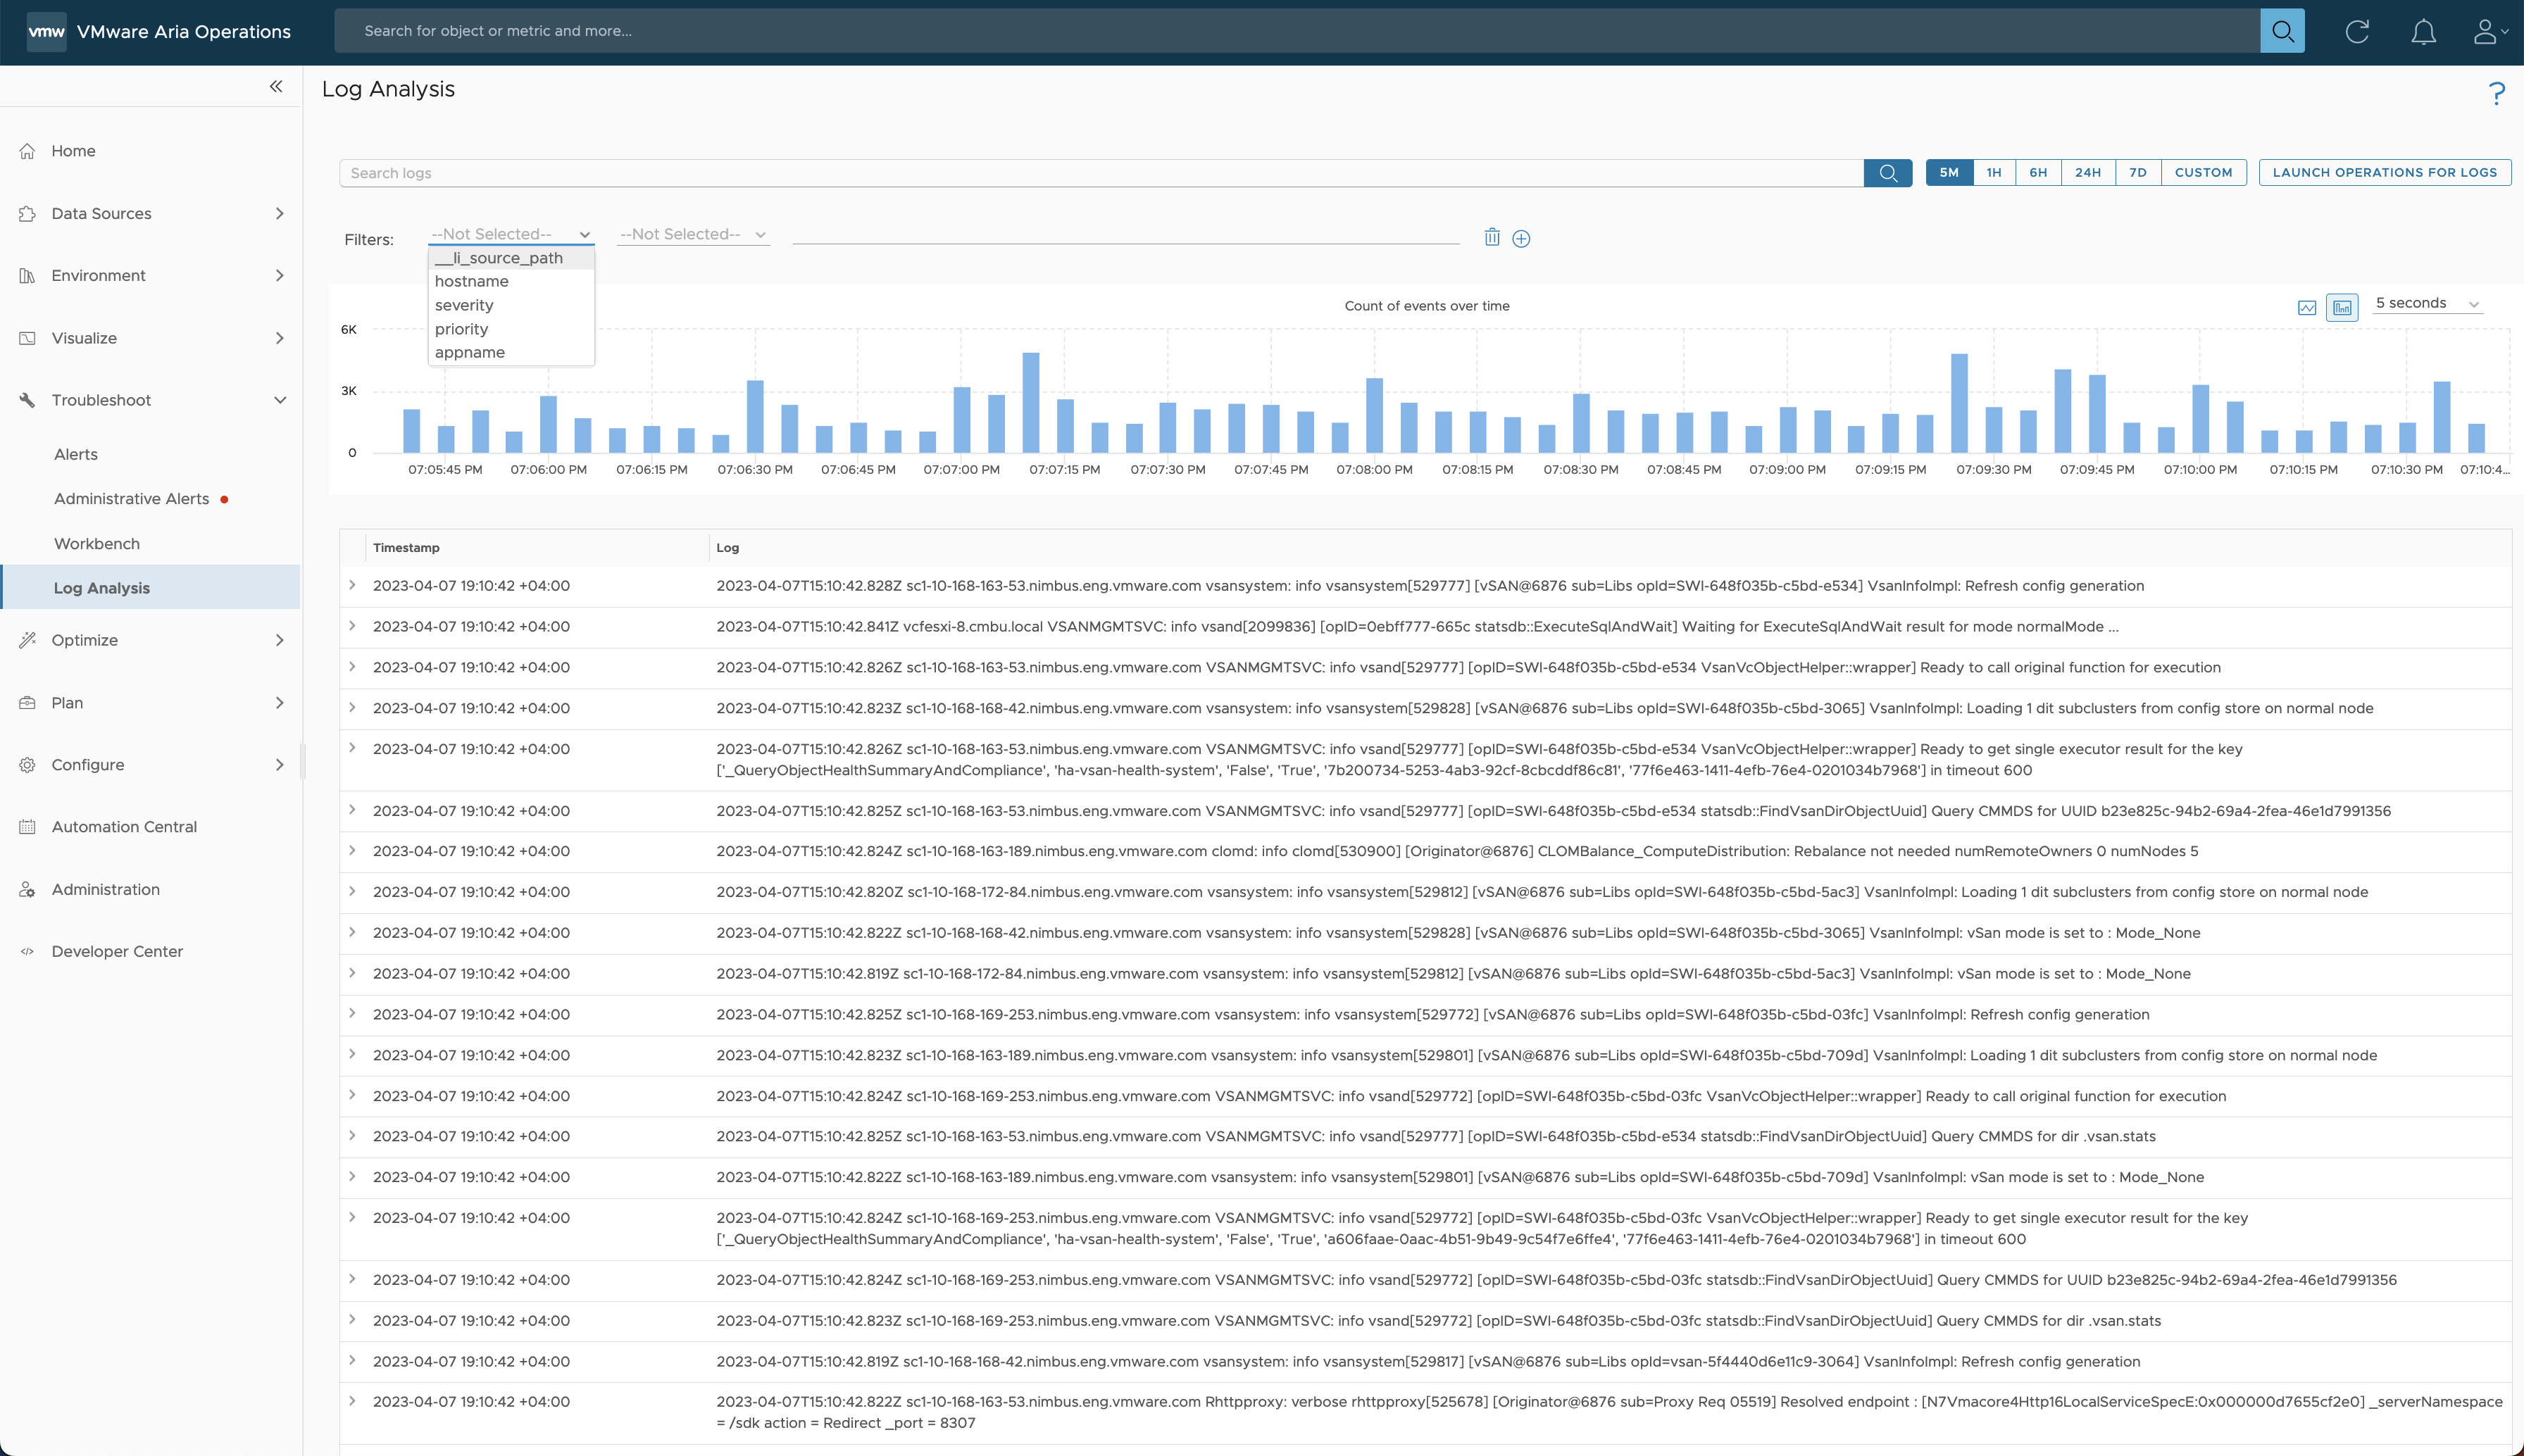
On this screen, you can quickly search for logs or filter down the logs displayed using the following options:
- Text Based Search
-
- Search bar: On the top of the screen is a search bar to search for logs.
- Time duration of logs: Change this value to display logs from a different time duration in the botton of the screen. The default is 5 minutes. Use Custom for a custom time duration.
- Advanced filtering
-
Use the advance filtering to narrow down the logs you are looking for. parses the logs and gives you advanced filtering capabilities.
- Filters: Use source (Use _li_source_path), hostname, severity, priority, and appname filters.
- Condition operators: Use filters with the contains, doesnotContain, startsWith, doesNotStartWith, matchesRegex, exist, and doesNotExist conditions.
- Query box: Input a query in the query box to filter the logs displayed.
The log analysis screen displays the event timeline in a bar chart by default. This tells you how the logs have spiked for the given time duration. You can correlate spikes in logs with metrics to narrow down the root cause of an issue. On the screen, you can change the event timeline frequency. You can switch from the bar graph to a line graph.
The logs are displayed in the bottom half of the page in a table which contains a timestamp and log column. In the table which displays the logs, you can expand a log to see more details.
Viewing Logs in VMware Aria Operations for Logs
Click the LAUNCH OPERATIONS FOR LOGS button to view the VMware Aria Operations logs in VMware Aria Operations for Logs.
