Configuring active health monitoring is similar to creating health checks on other load-balancers.
When you associate an active health monitor with a pool, the pool members are monitored according to the active health monitor parameters. To configure an Active Health Monitor, perform the following steps:
Procedure
- Click the Add (
 ) icon.
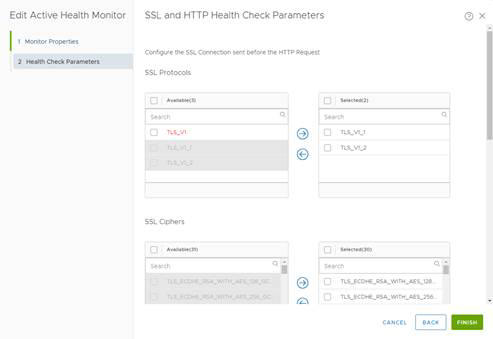
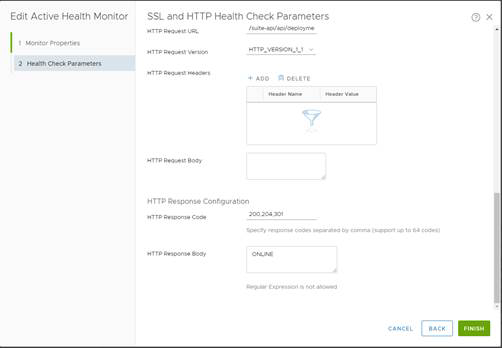
 - Configure Health check parameters withthe following values:
1.	Request Method
         GET
2.	Request URL
         /suite-api/api/deployment/node/status?services=api&services=adminui&services=ui
3.	Request Version
         HTTP_VERSION_1_1
4.	Response Status Codes
         200, 204, 301
5.	Response Body
         ONLINE (upper case)
6.	Ciphers
         TLS_ECDHE_RSA_WITH_AES_128_GCM_SHA256,
         TLS_ECDHE_RSA_WITH_AES_256_GCM_SHA384, TLS_ECDHE_RSA_WITH_AES_256_CBC_SHA,
         TLS_ECDHE_ECDSA_WITH_AES_256_CBC_SHA, TLS_ECDH_ECDSA_WITH_AES_256_CBC_SHA,
         TLS_ECDH_RSA_WITH_AES_256_CBC_SHA, TLS_RSA_WITH_AES_256_CBC_SHA,
         TLS_RSA_WITH_AES_128_CBC_SHA, TLS_ECDHE_RSA_WITH_AES_128_CBC_SHA,
         TLS_ECDHE_RSA_WITH_AES_128_CBC_SHA256,
         TLS_ECDHE_RSA_WITH_AES_256_CBC_SHA384, TLS_RSA_WITH_AES_128_CBC_SHA256,
         TLS_RSA_WITH_AES_128_GCM_SHA256, TLS_RSA_WITH_AES_256_CBC_SHA256,
         TLS_RSA_WITH_AES_256_GCM_SHA384, TLS_ECDHE_ECDSA_WITH_AES_128_CBC_SHA,
         TLS_ECDHE_ECDSA_WITH_AES_128_CBC_SHA256,
         TLS_ECDHE_ECDSA_WITH_AES_128_GCM_SHA256,
         TLS_ECDHE_ECDSA_WITH_AES_256_CBC_SHA384,
         TLS_ECDHE_ECDSA_WITH_AES_256_GCM_SHA384,
         TLS_ECDH_ECDSA_WITH_AES_128_CBC_SHA,
         TLS_ECDH_ECDSA_WITH_AES_128_CBC_SHA256,
         TLS_ECDH_ECDSA_WITH_AES_128_GCM_SHA256,
         TLS_ECDH_ECDSA_WITH_AES_256_CBC_SHA384,
         TLS_ECDH_ECDSA_WITH_AES_256_GCM_SHA384, TLS_ECDH_RSA_WITH_AES_128_CBC_SHA,
         TLS_ECDH_RSA_WITH_AES_128_CBC_SHA256, TLS_ECDH_RSA_WITH_AES_128_GCM_SHA256,
         TLS_ECDH_RSA_WITH_AES_256_CBC_SHA384, TLS_ECDH_RSA_WITH_AES_256_GCM_SHA384

         Note: Ciphers selection can be vary based on security requirements.
7.	Protocols
         TLS_V1_1, TLS_V1_2
8.	Server Auth
         IGNORE
9.	Certificate Chain Depth
         3
Name
Interval
Timeout
Retries
Type
Method
URL
Receive
vROPs_MONITOR
5
16
3
HTTPS
GET
suite-api/api/deployment/node/status?services=api&services=adminui&services=ui
-------------------------------------
Note:For older versions of vROPS from 6.6.1 to 7.5 please use the following URL call, as starting from vROps 8.0 status API enhanced to track separate services status:
/suite-api/api/deployment/node/status \r\n
ONLINE (upper case)
Here is an example of how the configuration must look like:
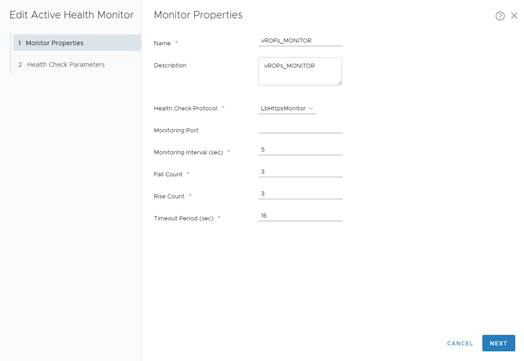
Example for vROPS_Monitor
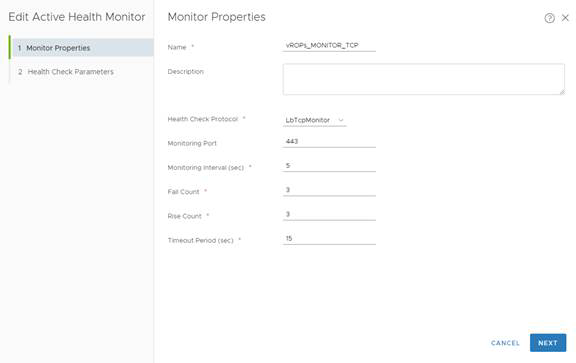
Note:There is an issue with active health monitor in version 2.3.0.1. For this version Active Health Monitor must be configured by the following way to avoid unexpected Virtual Servers down (Upgrade to NSX-T Version 2.4 is the permanent recommendation)
- Click the Add (
 ) icon.
 - Choose a name for the active health monitor and enter Monitor Properties (please refer to the example below)
1. Health Check Protocol
   LbTcpMonitor
2. Monitoring Port
   443
Note:LbTcpMonitor is pre-configured monitor for TCP protocol and it can be used for this Active Health Monitor