The search queries will run across your entire deployment and find all types of objects based on the specified search terms used in a search query. Additionally, VMware Aria Operations provides suggestions to build the search queries, which include recent searches that match the typed text in the global search bar. You can also find specific types of objects using conditions in the search query.

You can create a simple search query starting with a metric, property, or object type, or you can build a more complex query using different conditions to find all types of entities in VMware Aria Operations . Metric queries can be divided into two parts, the metric search query and the metric search result. After you create a metric search query, click Enter to view the Metric Search Results page.

You can also use instance metrics and super metrics to search for objects.

Procedure

  1. In the VMware Aria Operations Home page, click the Search bar and then select Metric.
    Note: When you click the cursor in the search bar, a list of suggestions with the metric and property names and the object types appear. You can select a metric, property, or object type from this list. If you hover over the metric and property names you can view the name of the object types that the metric or property belongs to. If you enter an entity in the search bar, the suggestions change and display options based on your entry. You can start with a metric name and then select the object type it belongs to, or start with an object type and add conditions.
  2. Create a simple query with a metric or property name. For example, enter CPU|Usage % in the search bar.
    If you start a metric search query with a metric name, you must always mention the object type it belongs to.
    Note: If the selected metric belongs to a single object type, then the object type will be selected by default.
  3. The object types change based on the metric you enter. Select Virtual Machine as the object type.
    A simple metric search query is created as follows: CPU|Usage % of Virtual Machine. A green banner with the Press enter to see the results or continue expanding the query. message appears.
  4. (Optional) Click Enter to view the results of this simple search query or continue to expand your search query to narrow down the search results.
    Note: If your query is incomplete, has a syntax error, exceeds the character limit of 300, or has more than five different metric names, the search query will not work. In such cases a red banner appears explaining the issue. For example, in case of a syntax error, the The query contains syntax error(s). Please modify it to get suggestions. message appears.
  5. The metric search query allows you to search for objects based on the conditions you use. Expand the search query with the where and childOf conditions.
    1. Add a where condition to filter the search results. You can combine the where conditions with logical operators to form complex metric search queries.
      Note: For string metrics the condition values are case insensitive.
      Operator Examples
      Numeric Operators
      > CPU|Usage % of Virtual Machine where CPU|Usage % > 15%
      >= CPU|Usage % of Virtual Machine where CPU|Usage % >= 15
      < CPU|Usage % of Virtual Machine where CPU|Usage % < 15
      <= CPU|Usage % of Virtual Machine where CPU|Usage % <= 15%
      = CPU|Usage % of Virtual Machine where CPU|Usage % = 15
      != CPU|Usage % of Virtual Machine where CPU|Usage % != 15
      + CPU|Usage % of Virtual Machine where (CPU|Usage % + Memory|Usage %) > 15
      - CPU|Usage % of Virtual Machine where (CPU|Usage % - Memory|Usage %) > 15
      * CPU|Usage % of Virtual Machine where (CPU|Usage % * Memory|Usage %) > 15
      / CPU|Usage % of Virtual Machine where (CPU|Usage % + Memory|Usage %)/2 > 15
      and CPU|Usage % of Virtual Machine where CPU|Usage % > 15 and Memory|Usage % > 15
      or CPU|Usage % of Virtual Machine where CPU|Usage % > 15 or Memory|Usage % > 15
      String Operators
      equals CPU|Demand MHz of Virtual Machine where Configuration|Name equals 'Centos'
      not equals CPU|Demand MHz of Virtual Machine where Configuration|Name notEquals 'Centos'
      contains CPU|Demand MHz of Virtual Machine where Configuration|Name contains 'Centos'
      notContains CPU|Demand MHz of Virtual Machine where Configuration|Name notContains 'Centos'
      startsWith CPU|Demand MHz of Virtual Machine where Configuration|Name startsWith 'Centos'
      notStartsWith CPU|Demand MHz of Virtual Machine where Configuration|Name notStartsWith 'Centos'
    2. Use the childOf condition at the end of your query to select an ancestor of the object type to further narrow down your search results. Select the object name, for example, select vSphere World.
    A complex search query is created as follows: CPU|Usage % of Virtual Machine where CPU|Usage % > 15 or Memory|Usage % > 15 childOf vSphere World
  6. Click Enter to view the metric search results.
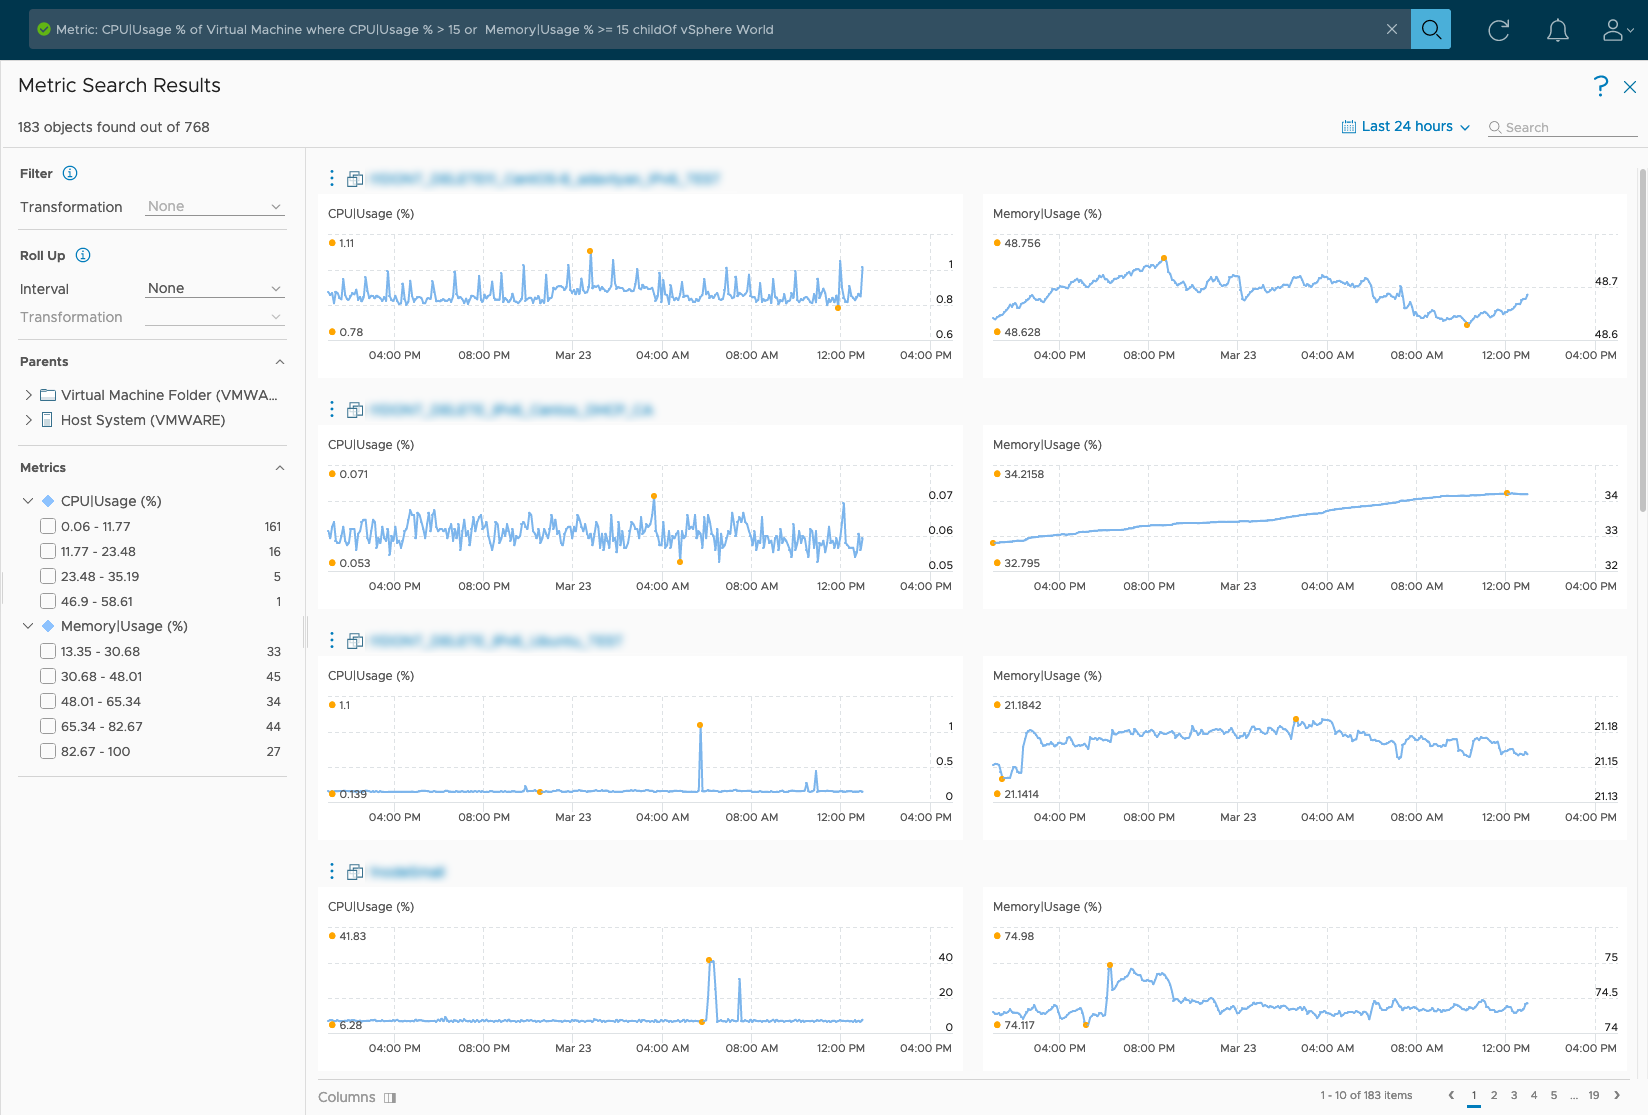
    The search result is displayed on the Metric Search Results page.
  7. The metric search results page displays the total number of objects that match the query. You can use the filter options on this page to further drill down the results and find the required information.
    Option Description
    Filter: Transformation

    The Transformation filter applies to the actual query and not the results as it applies to objects before the search query runs and cannot be used on the results.

    Determines what calculation method is applied to the raw data. You can convert the metric values of the search results using the transformation option and also select the type of transformation:
    • Minimum. The minimum value of the metric over the selected time range.
    • Maximum. The maximum value of the metric over the selected time range.
    • Average. The mean of all the metric values over the selected time range.
    • Sum. The sum of the metric values over the selected time range.
    • First. The first metric value for the selected time range.
    • Last. The last value of a metric within the selected time range.
    • Current. The last available value of a metric if it was last updated not before five collection cycles were complete, otherwise, it is null.
    Note: This option is available only if there is a where condition and the number of objects for the mentioned object type do not exceed the limit of 200 for not more than one month.
    Roll Up The roll up filter is used to change data visualization based on the selected time interval and transformation. You can select one of the available options ranging from hour, day, week, month, quarter, or year. For example, if you select Hour as the interval and the Maximum as the transformation, then the system displays maximum values for each one-hour interval.
    Parents The parent objects grouped by type for the found objects that the metrics in the query belong to. You can use this option to further narrow down the results.
    Metric Displays the metrics value distribution. The metric values are divided into 5 ranges and the number of objects which have the metric lying in that range is available.
    Time Settings Use the time settings to select the time range for the query. The number of objects based on metrics in the selected time range is also displayed. You can select a time range to view the information. You can set a time range for a past period or set a future date for the end of the time period.
    Page Navigation The page navigation option appears when the results resource count exceeds 10. Use the page navigation to continue viewing search results displayed on the next pages.
    Columns If the query contains more than two metrics, you can view the search results of two metrics at a time. Use the columns icon to select which two metrics search results are displayed.

What to do next

To further troubleshoot objects, click the vertical ellipsis and select troubleshoot to go to the troubleshooting workbench page. For more information, see Discovering Potential Evidences Using the Troubleshooting Workbench.