VMware Aria Operations includes a broad set of simple to use, but customizable dashboards to get you started with monitoring your VMware environment. The predefined dashboards address several key questions including how you can troubleshoot your VMs, the workload distribution of your hosts, clusters, and datastores, the capacity of your data center, and information about the VMs. You can also view log details.
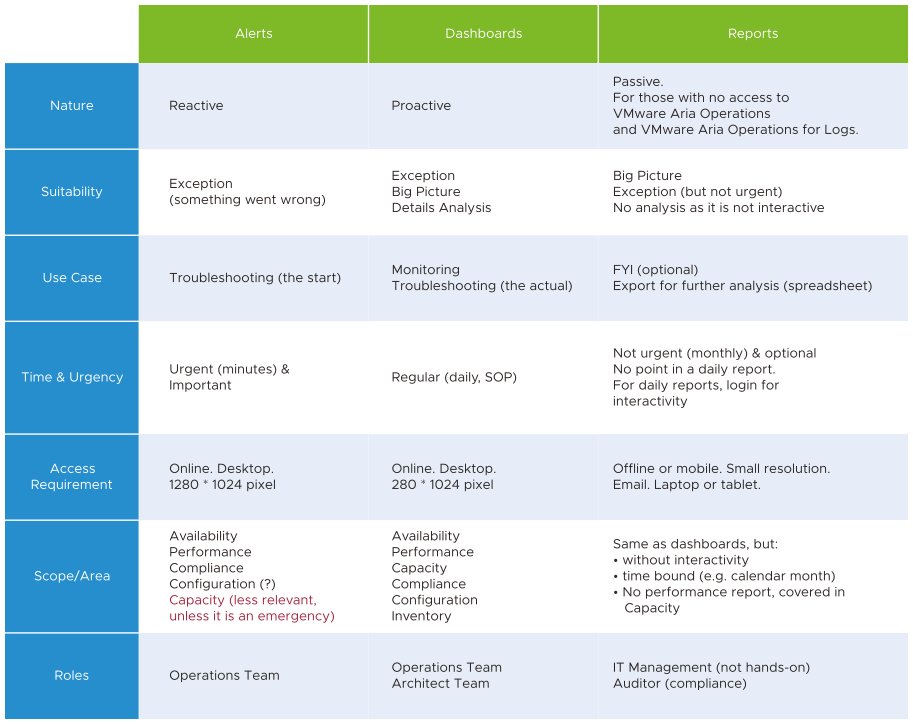
Each set of dashboards is complemented with a series of out-of-the-box customizable alerts and reports to assist with your operational awareness. Alerts, reports, and dashboards, each have a purpose with minimal overlap. Several activities that are carried out using alerts should be carried out using dashboards. Reports should be kept to a minimum as they are not interactive and do not provide timely information.
The following table details how alerts, dashboards, and reports are complimentary.

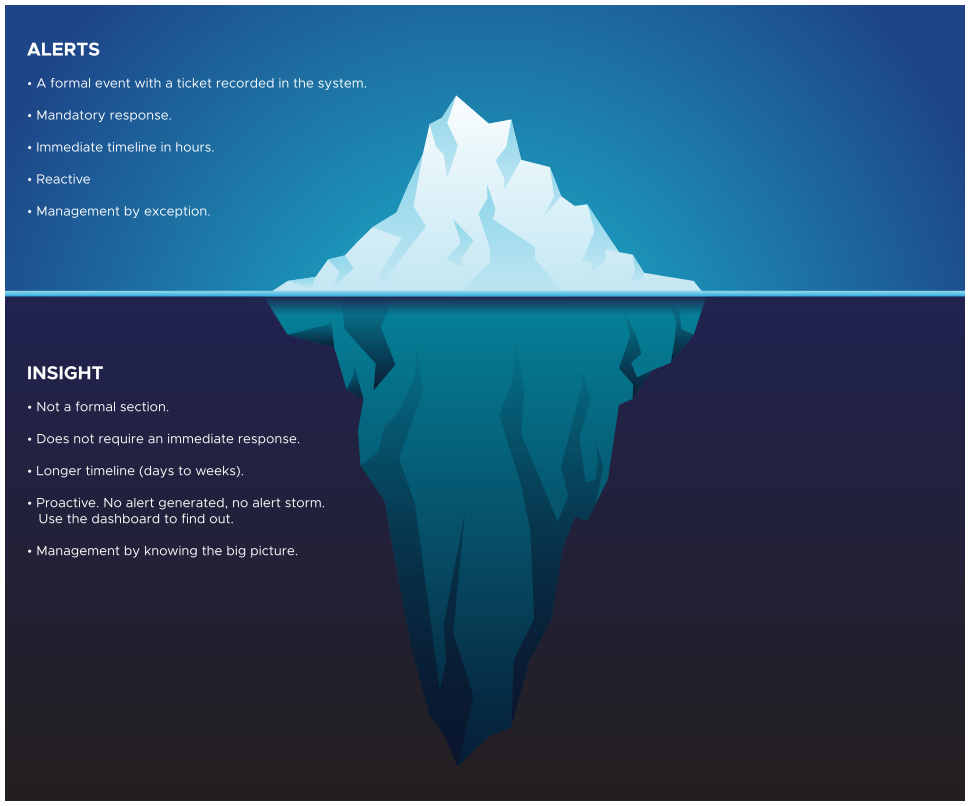
Insight vs Alerts
VMware Aria Operations dashboards support a concept we call insight. Insight complements alerts but does not replace it. Alerts miss the larger picture and only see what is triggered. For one object that reaches the threshold, there might be many just beneath the threshold. The objects below the threshold are called insight.
Alerts might auto-close if the symptoms disappear. Managing alerts is not the same as minimizing alerts. Minimizing alerts is about preventing alerts.

Working with Predefined Dashboards
To access the predefined dashboards, from the left menu, click .
You can customize dashboards and widgets if you have VMware Aria Operations Advanced edition or higher. Any customization you make is overwritten during upgrade and as a result, it is recommended that you back up your dashboards before an upgrade.