


vSphere Pods run containers without needing to customize a Kubernetes cluster. You can deploy vSphere Pods directly on ESXi hosts It hosts a type of resource pool called Namespace. The vSphere Pod Summary tab provides an overview of the state of the vSphere Pods.
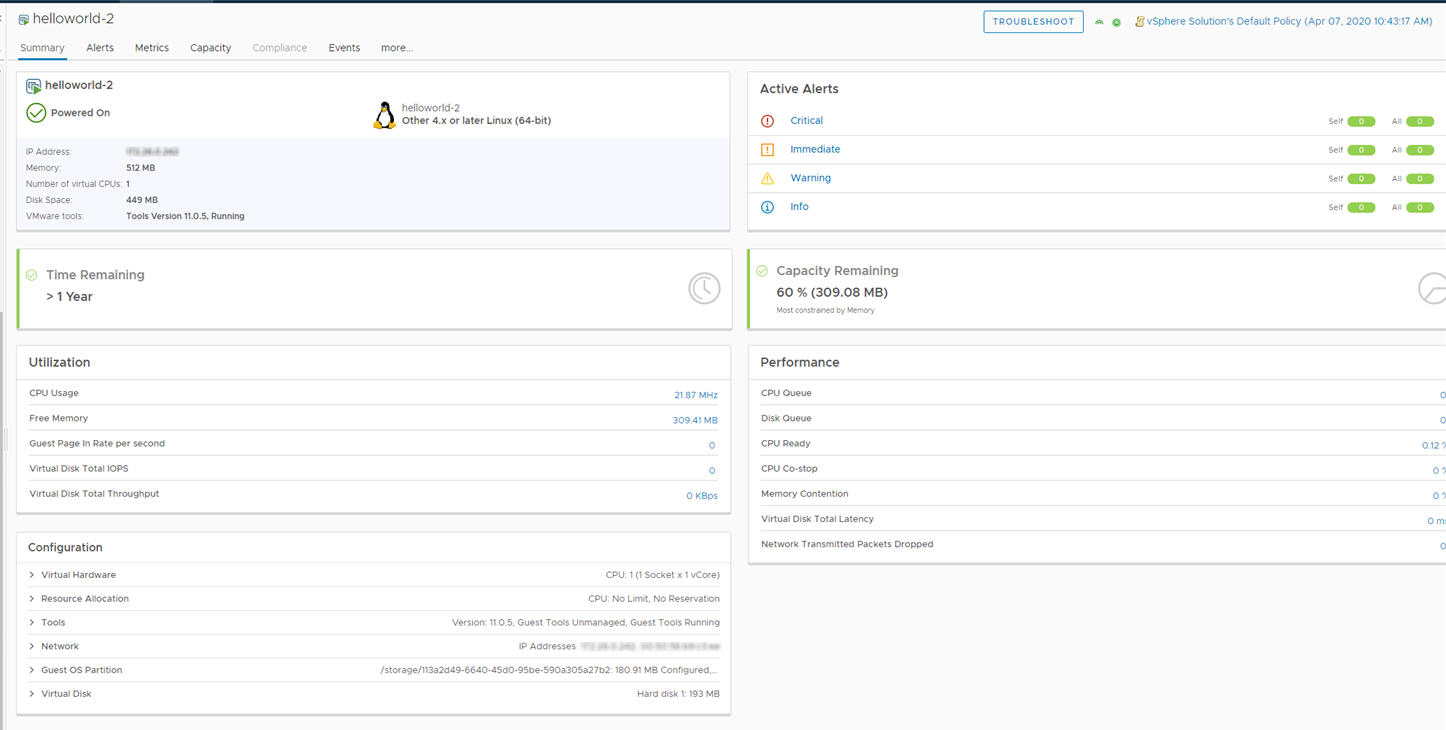
Understanding the vSphere Pod Summary Tab
| Option | Description |
|---|---|
| Troubleshoot | Start the Troubleshooting Workbench with the current object in context. |
| Object Summary | This widget displays the details of the selected object. The widget also displays the number of resources associated with the selected object. |
| Active Alerts |
This widget provides a visual indicator of the alert status for the following alert types.
To see the alerts for the object, click the labels of the alert. |
| Time Remaining | This widget displays the number of days remaining until the projected resource utilization crosses the threshold for the usable capacity. |
| Capacity Remaining | This widget displays the unused capacity of your virtual environment to accommodate new virtual machines. |
| Utilization | This widget is used to find out the trends in capacity used by a selected vSphere Pod as against the total capacity available.
The key utilization indicators are:
|
| Performance | This widget displays the summary metrics about the overall performance of the object. It displays the latest value and a trend line of the various key performance indicators in a color that indicates its health based on the symptom associated with the metrics. Click each metric to see the expanded chart.
The key performance indicators are:
|
| Configuration | This widget displays the hardware, CPU, and Network configuration details of the host. |
