


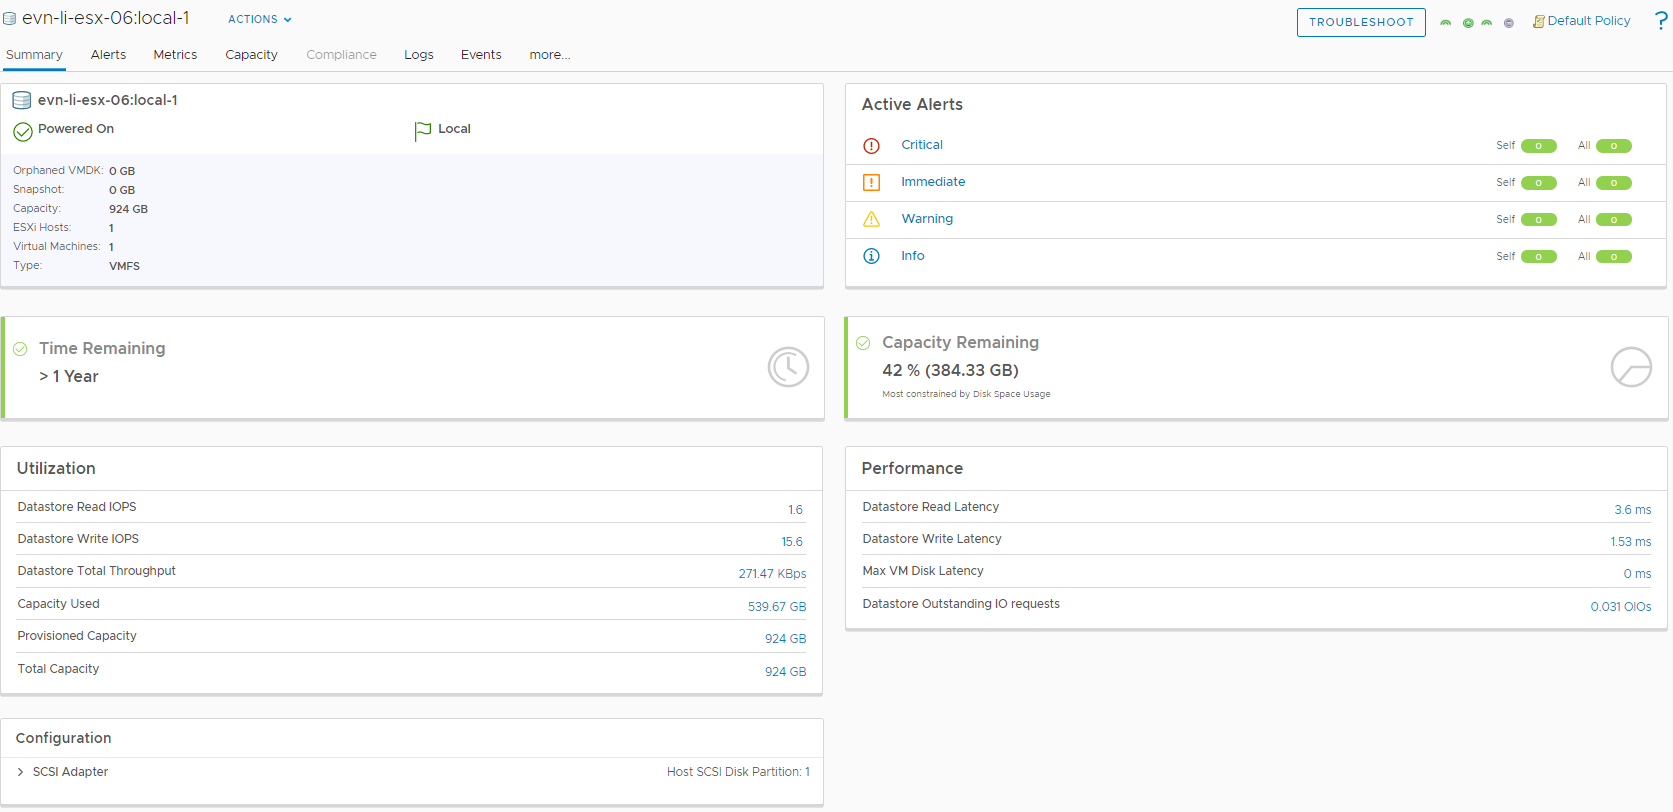
The Datastore Summary tab provides an overview of the state of the selected datastore. For the selected object, the Datastore Summary tab displays the alerts and metrics as they affect the health, risk, or efficiency. Use this tab to evaluate the impact that alerts are having on the datastore and use the information to begin troubleshooting problems.
Understanding the Datastore Summary Tab
| Option | Description |
|---|---|
| Troubleshoot | Start the Troubleshooting Workbench with the current object in context. |
| Object Summary | This widget displays the details of the selected object. The widget also displays the number of resources associated with the selected object. |
| Active Alerts |
This widget provides a visual indicator of the alert status for the following alert types.
To see the alerts for the object, click the labels of the alert. |
| Time Remaining | This widget displays the number of days remaining till the projected resource utilization crosses the threshold for the usable capacity. |
| Capacity Remaining | This widget displays the unused capacity of your virtual environment to accommodate new virtual machines. |
| Utilization | This widget is used to find out the trends in capacity used by a selected datastore as against the total capacity available. |
| Performance | This widget displays the summary metrics about the overall performance of the object. Click each metric to see the expanded chart. |
| Configuration | This widget displays the configuration details for the selected datastore object. |
