Pool-related workflow is essentially the same as prior to the advent of pool sharing.
While working with pools or pool groups continue to be the same, with pool group sharing:
There is an increased number of pool group choices when configuring a virtual service.
There are more ways to extract pool-related information when querying for statistics.
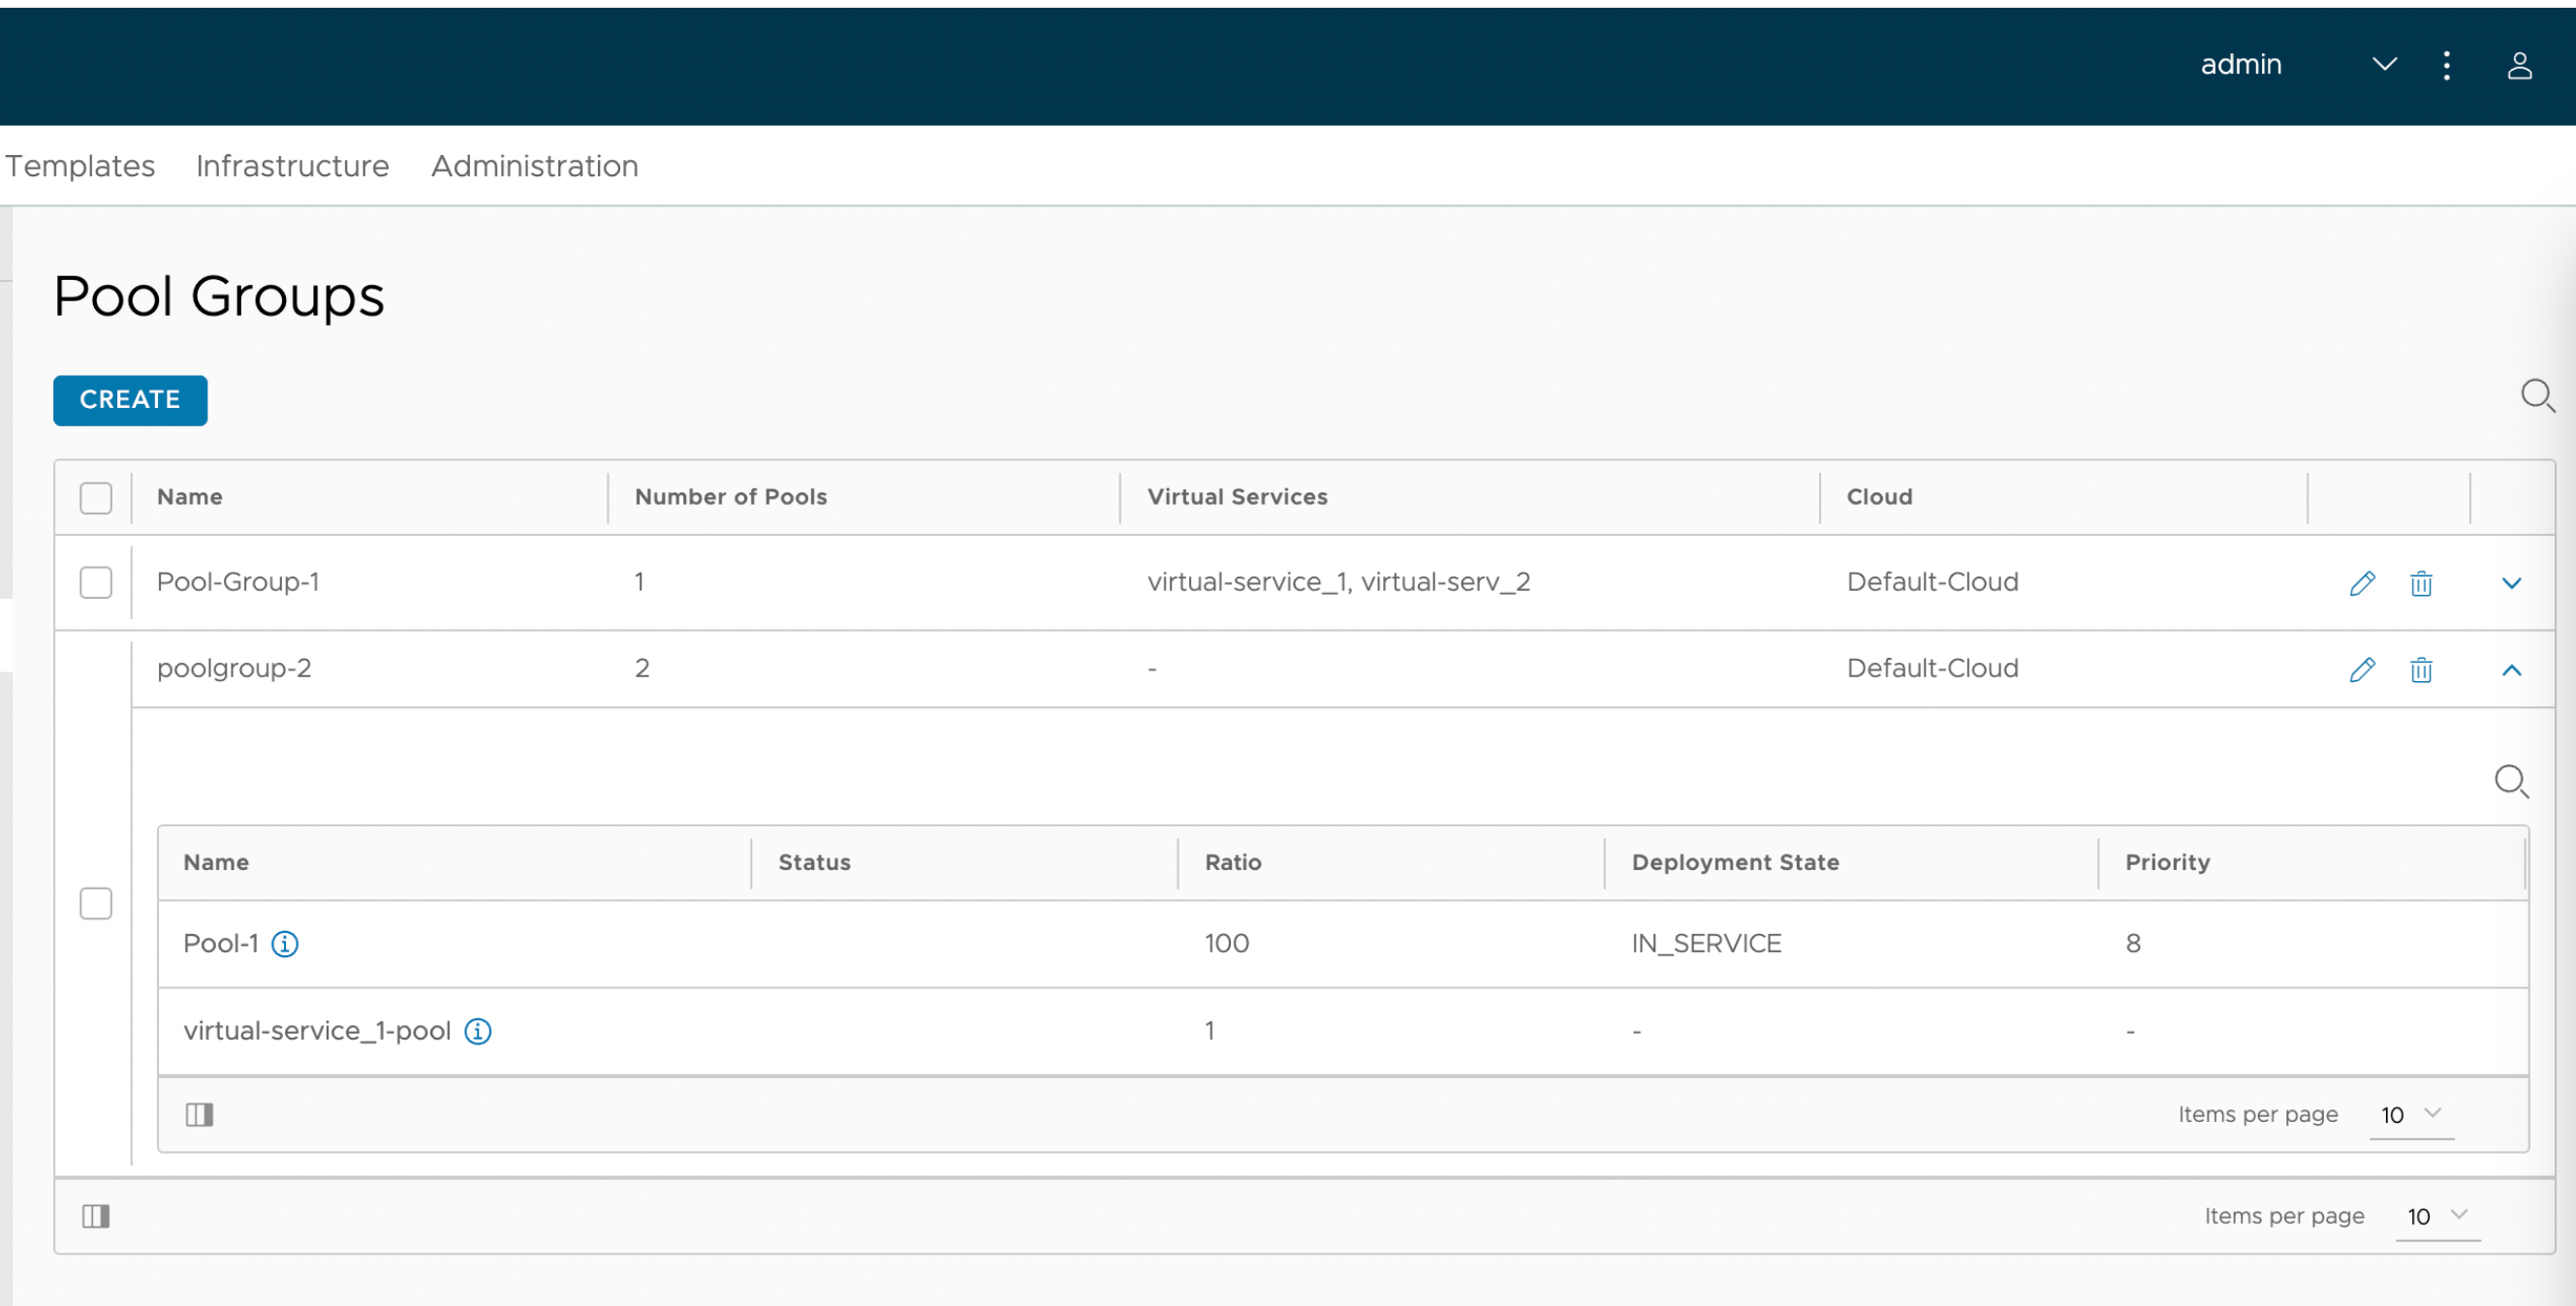
To assign a pool group to an existing virtual service:
Impact on Avi Load Balancer UI
Navigate to .
Click the edit icon against the required virtual service.
Select Pool Group in the Edit Virtual Service screen.
-
Select the required pool groups from the list.Note:
You can also create a pool group by clicking Create Pool Group or navigating to .

Click Save.
The ability for a single virtual service to be associated with multiple pools is unchanged. The selected pool groups are now assigned to the required virtual services. With pool group sharing, you can see there is a broader set of pool groups available.
Reporting
Navigate to .
Click the View VS Tree filter.
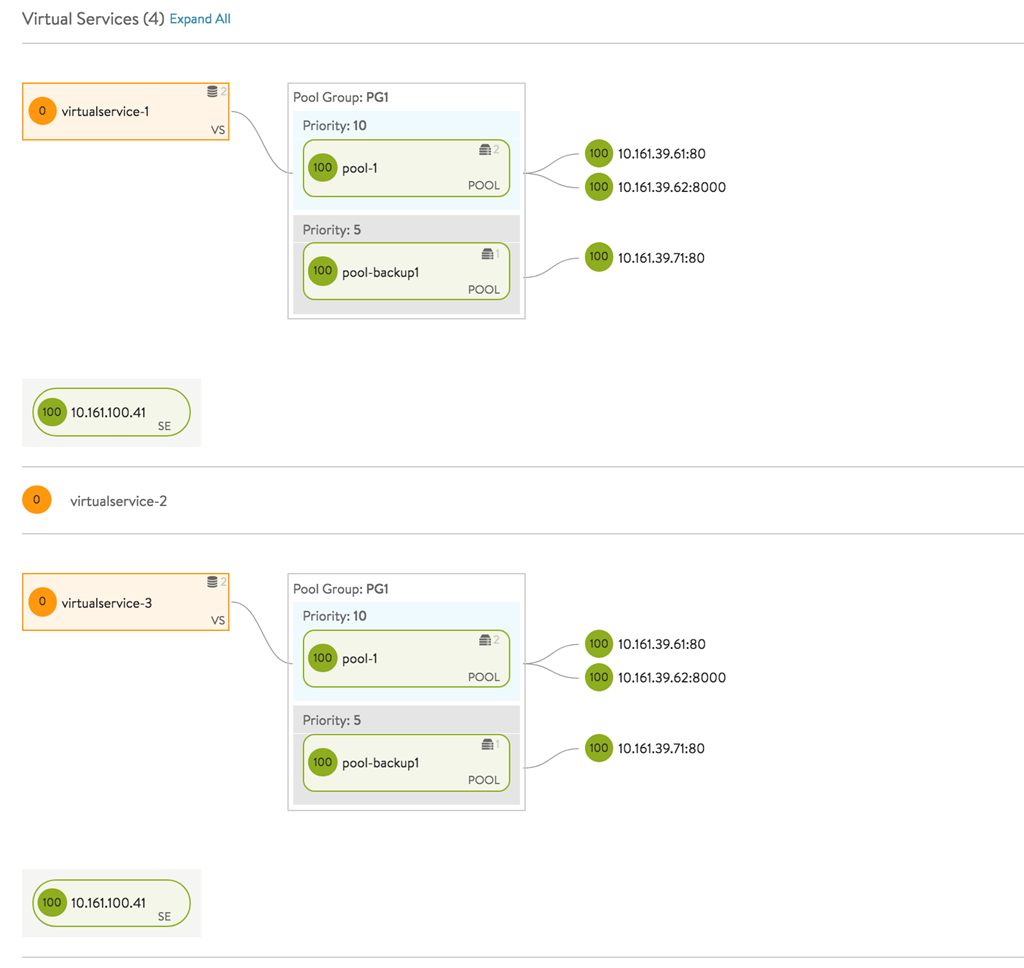
Select the specific virtual service. Pool group sharing set up with the virtual service is represented as shown in the following image:

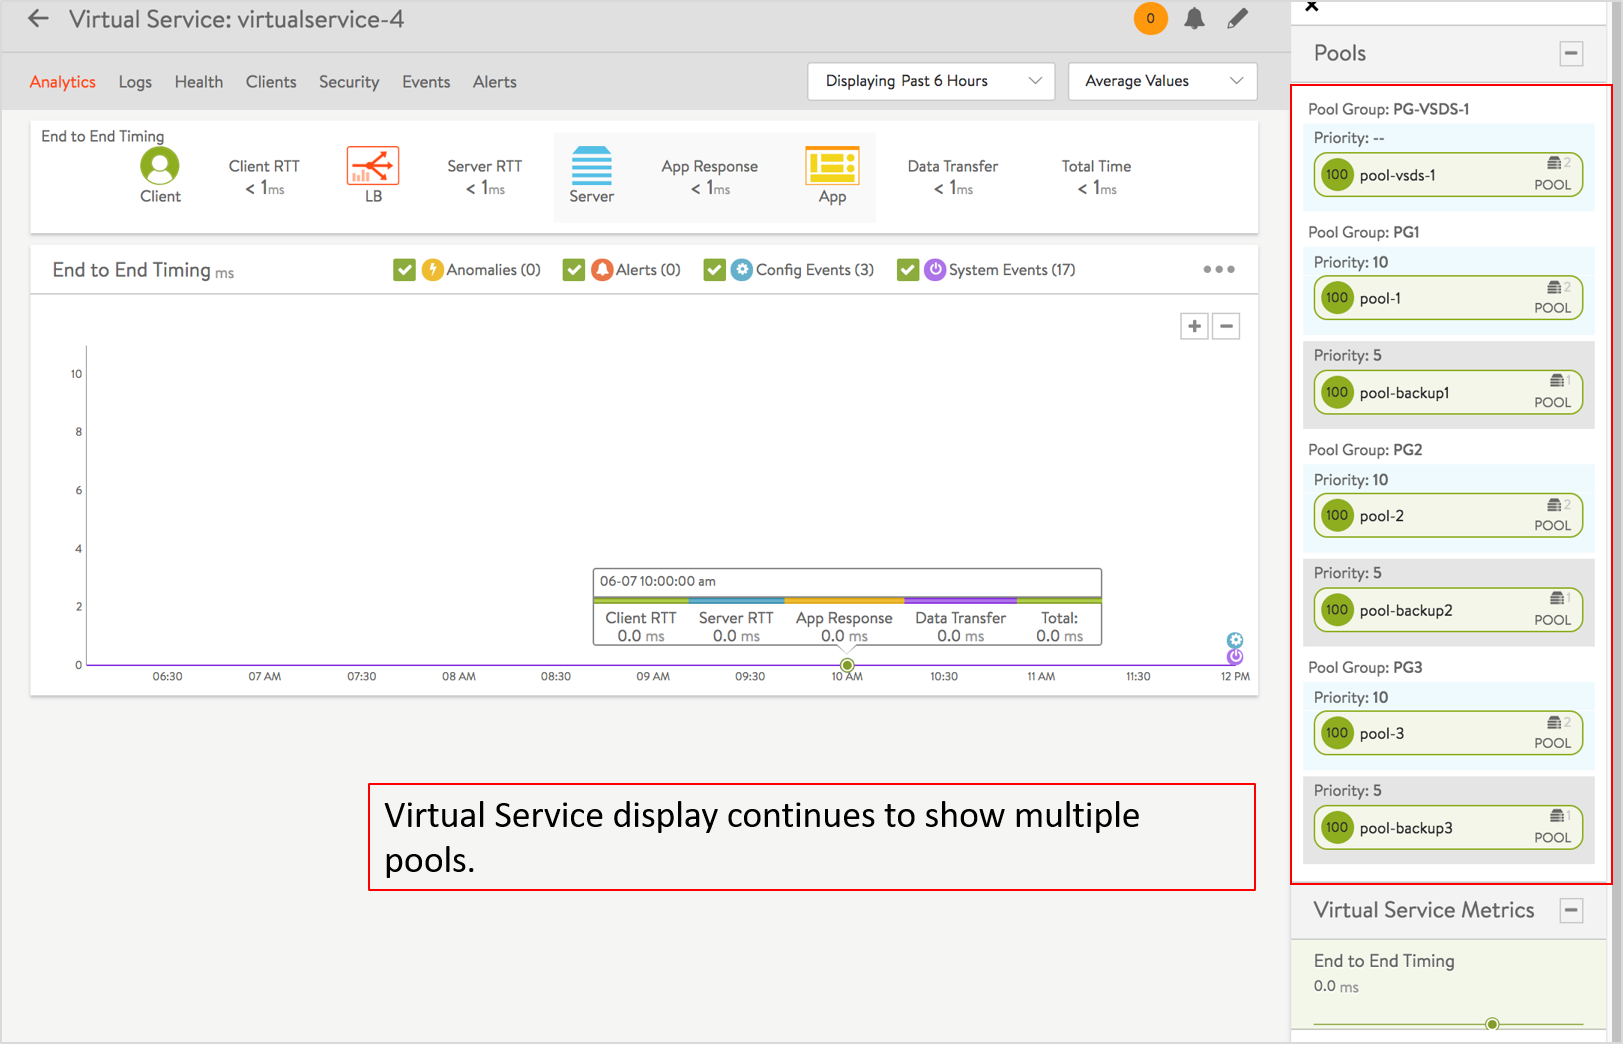
Click a virtual service to view the pool groups associated. The following image shows the Virtual Service screen for a selected virtual service, with the pool groups shared:

You can see the ability for a single virtual service to be associated with multiple pool groups.
Impact on Avi Load Balancer CLI
Configuration of a shared pool is no different than before.
Reporting has been expanded, as illustrated by the below command line examples:
Show stats for each server in the named pool, filtered by SE and virtual service:
show pool <pool-name> server detail filter <se-name> filter <vs-name>
Show stats for all servers in the named pool for each visual service placed on the given SE:
show pool <pool-name> server detail filter <se-name>
Aggregating across all SEs on which the named virtual service is placed, show stats for each server in the named pool:
show pool <pool-name> server detail filter <vs-name>
For all virtual services placed on the SE group, and aggregating across all SEs, show stats for each server in the named pool:
show pool <pool-name> server detail
Aggregating across all SEs on which the named virtual service is placed, show stats for the named pool:
show pool <pool-name> detail filter <vs-name>
State of Virtual Services
When virtual services sharing the same pool are placed on multiple SEs, and each SE has different reachability to application servers in the back-end pool, the virtual service and the pool states reflect this. This is different from the state reported when a single virtual service is scaled out across Service Engines.
You can check a pool’s operational capability with a show pool <shared-pool> summary command, which has percent_servers_up_enabled set to True. For instance, if one of the two SEs has no reachability to the back-end servers, then this will be 50%.
Virtual Service Placement
Unless specifically constrained, virtual services sharing the same pool can be placed on multiple Service Engines. If the virtual services are placed on multiple SEs in different SE groups (not to be confused with intra-SE-group scaleout), constraints such as max-connections are enforced on a per-SE-group of scaled-out SEs.
Virtual Service Events
Any operational events on the shared pool is reflected on all its virtual services’ contexts. However, when adding subsequent virtul services (after the first VS is created and associated with a pool) to share the pool, the pool’s prior events will not be reflected on the subsequently added VSs. However, all future events will show up.
Metrics, Alerts and Health Score
Metrics, alerts and health score for the pool are an aggregate of the pool’s traffic/ state across all virtual services. Service Engines do keep metrics information on a per-server, per-virtual-service basis. CLI commands/ REST APIs can be used to get this information for troubleshooting purposes.