This section explains on how to capture the virtual service traffic using CLI/UI.
Capturing Virtual Service Traffic using UI
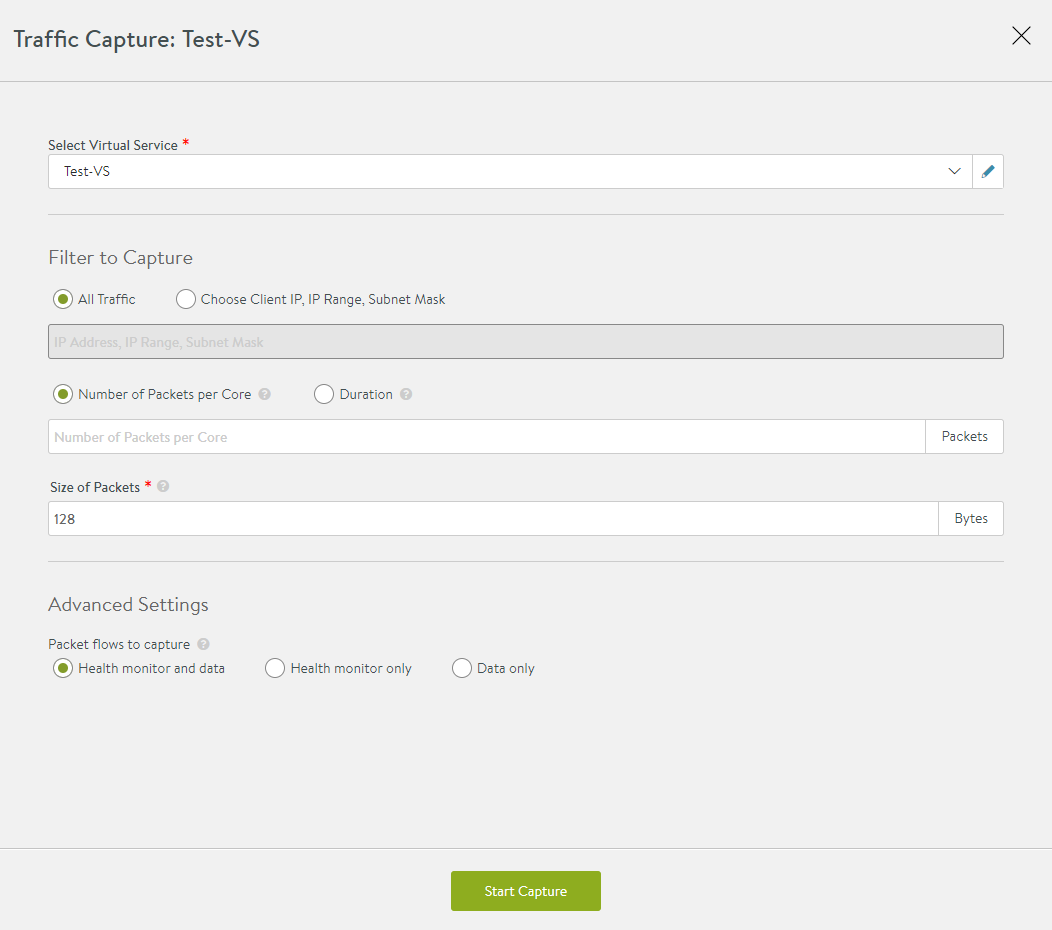
Navigate to . The Capture Configuration section displays the parameters defined for current captures.
Click the pencil icon to start a new capture.

In the Traffic Capture pop-up window, select the following based on your requirement:
Field Name |
Action |
|---|---|
Select Virtual Service |
Choose the virtual service for which you want to capture traffic. This capture includes both the client-to-SE and SE-to-server side of the connection. The traffic will be captured on all SEs handling traffic for that virtual service. |
Filter to Capture |
All Traffic - Capture all traffic. Choose Client IP, IP Range, Subnet Mask - Capture traffic only for the specified IP address, list or range of IP addresses, or subnet. The IP addresses can be client or server addresses.
Note:
|
Number of Packets per Core |
Specify the maximum number of packets to capture in the core. |
Duration |
Specify the time in minutes to run the capture. |
Size of Packets |
Specify the size of the packet, in bytes, to be captured. This is similar to the snaplen option in TCPdump. To capture the entire packet, enter 0. |
Under the Advanced Settings section, select one of the following options:
|
Control the captures for health monitor flows. |
Capture Session Key |
Enable session key capture. |
Click Start Capture to view the progress of the capture.
For more information on enabling session key capture, see Enabling Session Key Capture When Debugging a Virtual Service.
Completed Captures
On completing the capture, the Controller collates data from multiple SEs and formats the data into a PCAP file. These captures are then displayed under the Completed Captures section. It is tabluated as Date, Virtual Service Name, and Size of Packets captured, which can be exported by downloading them in the pcap format. The capture file can be viewed using any standard traffic capture utility.
The virtual service packet capture feature does not capture mid-flow packets.
Capturing Virtual Service Traffic using CLI
To capture packets using the Avi Load Balancer CLI, log into the shell prompt and enter the packet capture sub-mode for the desired virtual service.
debug virtualservice Test-virtual service
Updating an existing object. Currently, the object is:
+-------+-----------------------+
| Field |        Value          |
+-------+-----------------------+
| uuid  | virtualservice-0-1    |
| name  | Test-virtual service  |
+-------+-----------------------+
Parameter |
Definition |
|---|---|
capture_params duration |
Time, in minutes. The default is unlimited. |
capture_params num_pkts |
Maximum number of packets to collect. Default is unlimited. |
capture_params pkt_size |
Packet size or snap length to capture. The default is unlimited. |
debug_ip addrs |
IPv4 address format. |
debug_ip prefixes |
IPv4 prefix format <x.x.x.x/x>. |
debug_virtual service_hm_include |
Include health monitor packets in the capture. |
debug_virtual service_hm_none |
Omit health monitor packets from the capture (the default). |
debug_virtual service_hm_only Capture |
Only health monitor packets. |
The debug_ip command enters a sub-mode. It allows to enter multiple IP addresses or IP subnets. Omit the debug_ip option for subsequent entries. Save to commit the desired IPs and return to the previous menu.
By default, no maximum packets or duration of time to be captured are defined. It is recommended to include a maximum packet capture . Without a limit, the capture will run until the Avi Load Balancer SE drive is full, potentially disrupting service.
Specify parameters, including the maximum number of packets to capture.
debugvirtualservice> capture_params num_pkts 1000
debugvirtualservice> debug_ip addrs 10.10.10.10
debugvirtualservice:debug_ip> save
Begin capturing based on the previously configured parameters.
debugvirtualservice> capture
debugvirtualservice> save
+----------------+--------------------+
| Field          |          Value     |
+----------------+--------------------+
| uuid           | virtualservice-0-1 |
| name           | Test-VS            |
| debug_ip       |                    |
| addrs[1]       | 10.10.10.10        |
| capture        | True               |
| capture_params |                    |
| duration       | 0 mins             |
| num_pkts       | 1000               |
+----------------+--------------------+
Re-enter the packet capture sub-mode and stop an ongoing packet capture.
debug virtualservice Test-virtual service
debugvirtualservice> no capture
debugvirtualservice> save
Capturing Virtual Service Packet in PCAPng Format
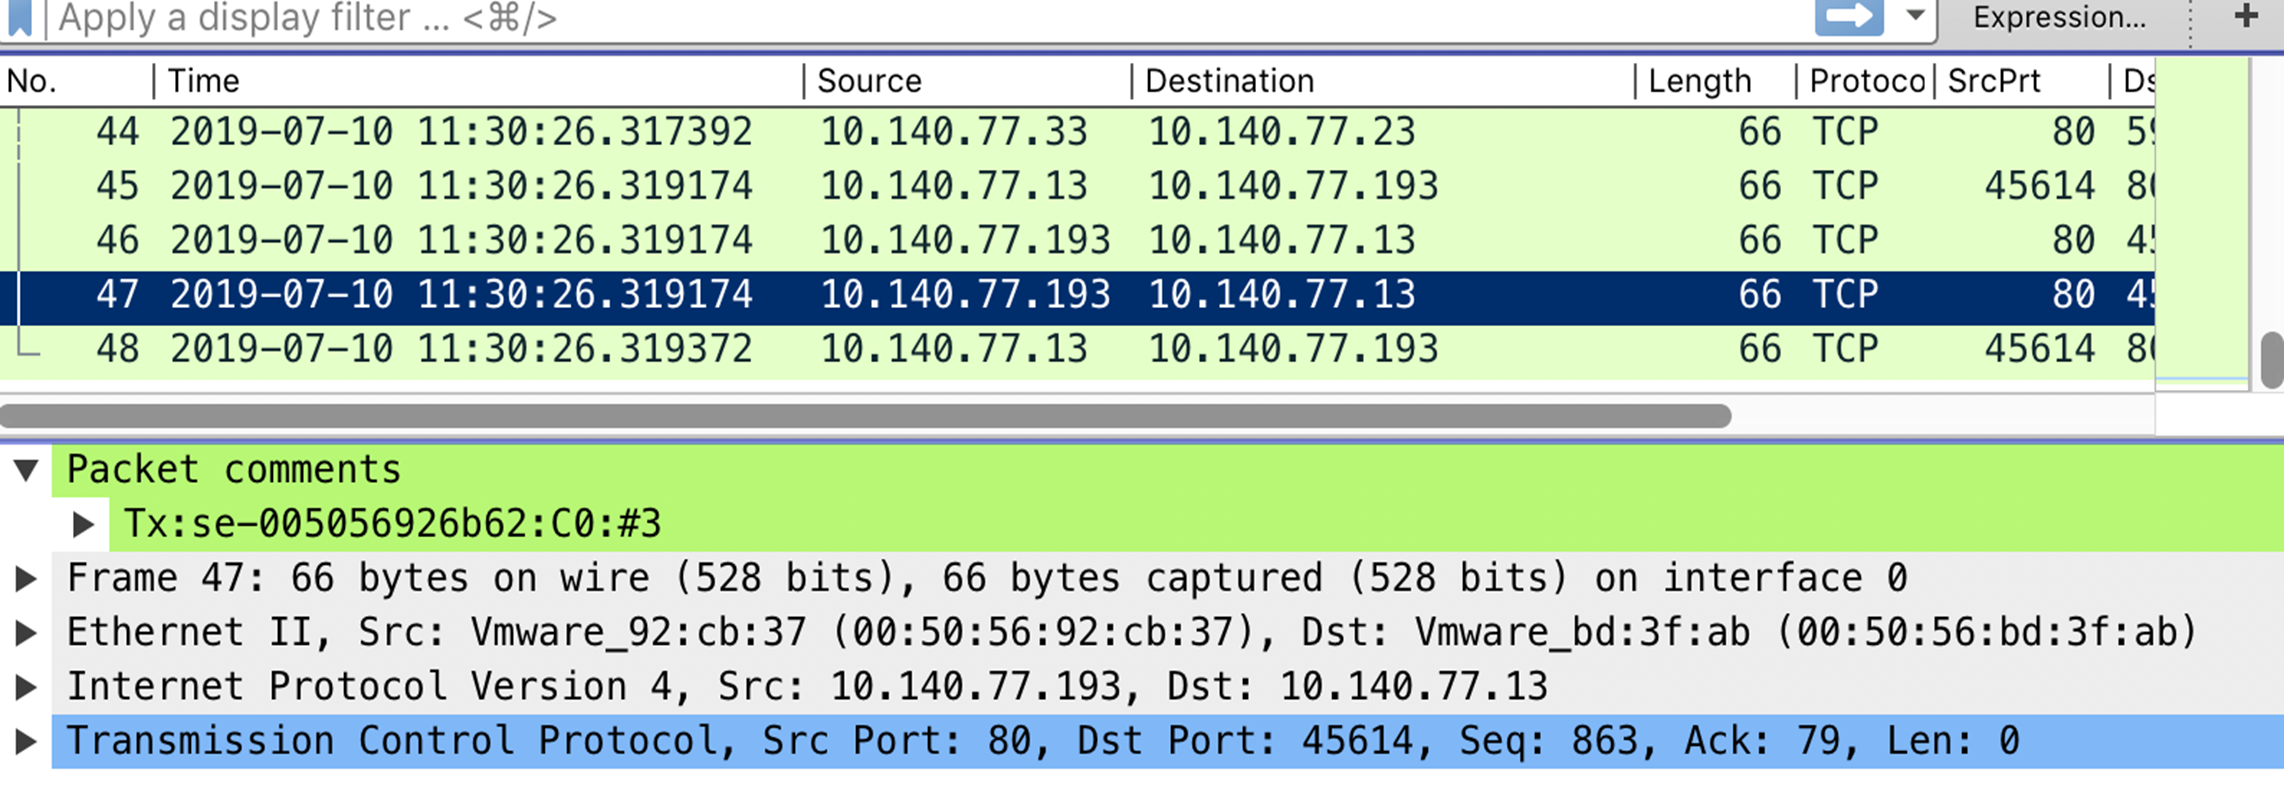
Virtual service packets can be captured in PCAPng format. Each packet contains the transmission direction, se-uuid, and core number that processed it. The frontend and backend flows are provided with a unique flow ID that allows you to co-relate the frontend and backend connections in the packet captures without going back to connection/app logs.
The flow ID might not be present for all packets in the flow.
To turn off this feature and fallback to PCAP, you can use the following command.
debug virtualservice <>
capture_params
no pcap_ng
The following is the sample of the output as viewed on Wireshark.

Exporting Packet Capture for Virtual Service and Service Engine Pcaps
Export the packet capture to a remote system that can view it using a tool like TCPdump or Wireshark.
show debug virtualservice Test-virtual service capture
Please specify the destination directory: /tmp
Downloaded the attachment to /tmp/virtual service_virtualservice.20141205_192033.pcap
bash
scp /tmp/virtual service_virtualservice.192033.pcap [email protected]:/tmp