


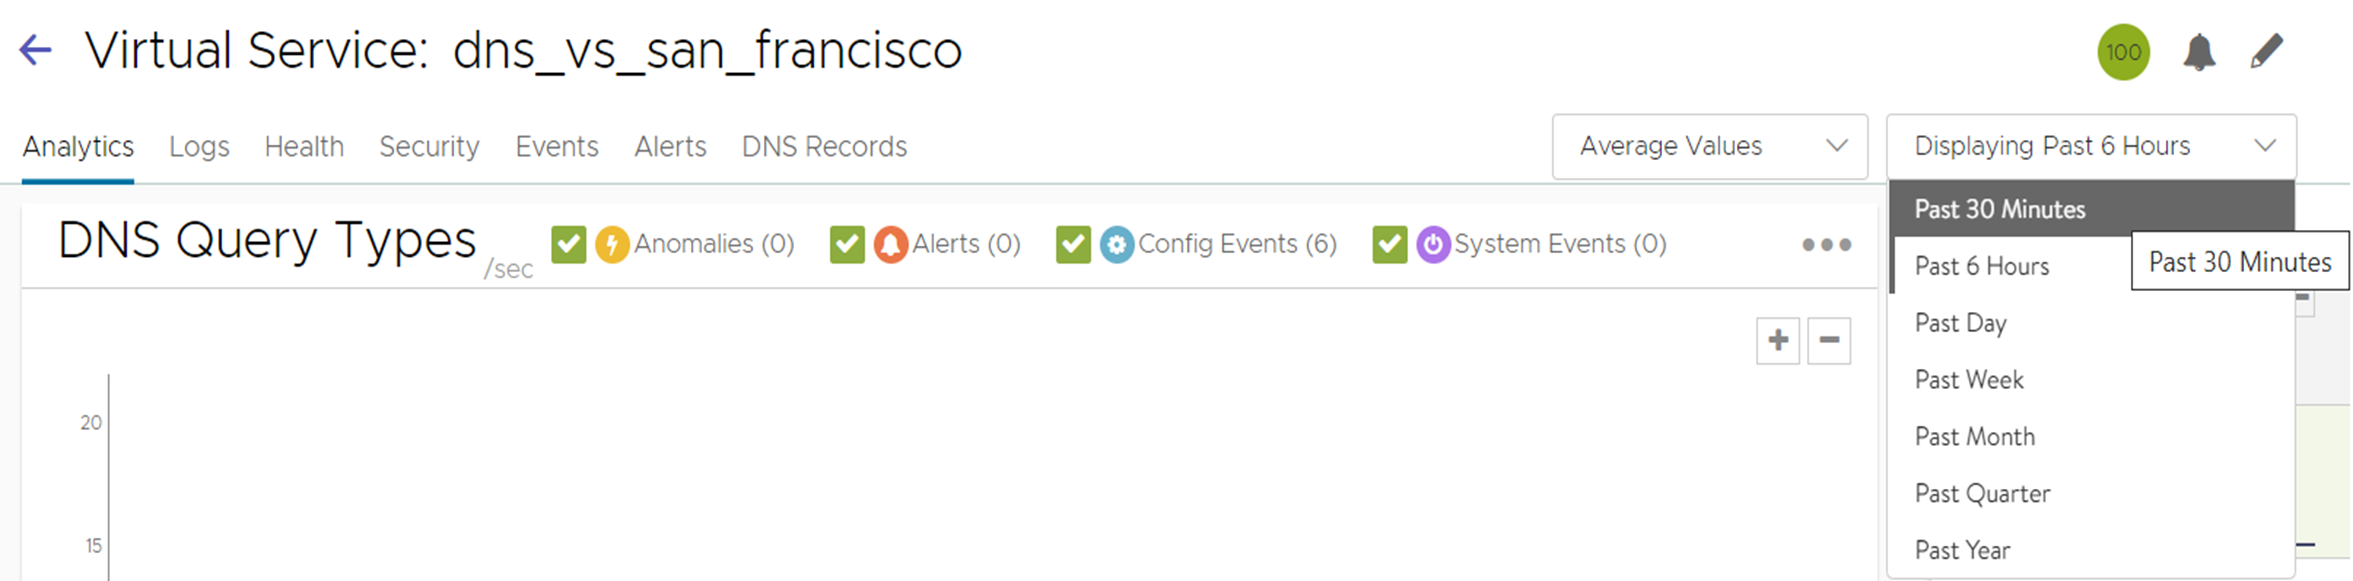
The Avi Load Balancer UI displays real-time metrics for objects such as virtual service, pool, server, and so on. The Past 30 Minutes option is suggested for clearer viewing. However, the graphs might update only every few minutes, resulting in five-minute blocks of averaged data.
Reasons for Slowdown
When a new virtual service is first created, the update frequency for analytics metrics data is set to capture metrics aggressively for the first 30 minutes.
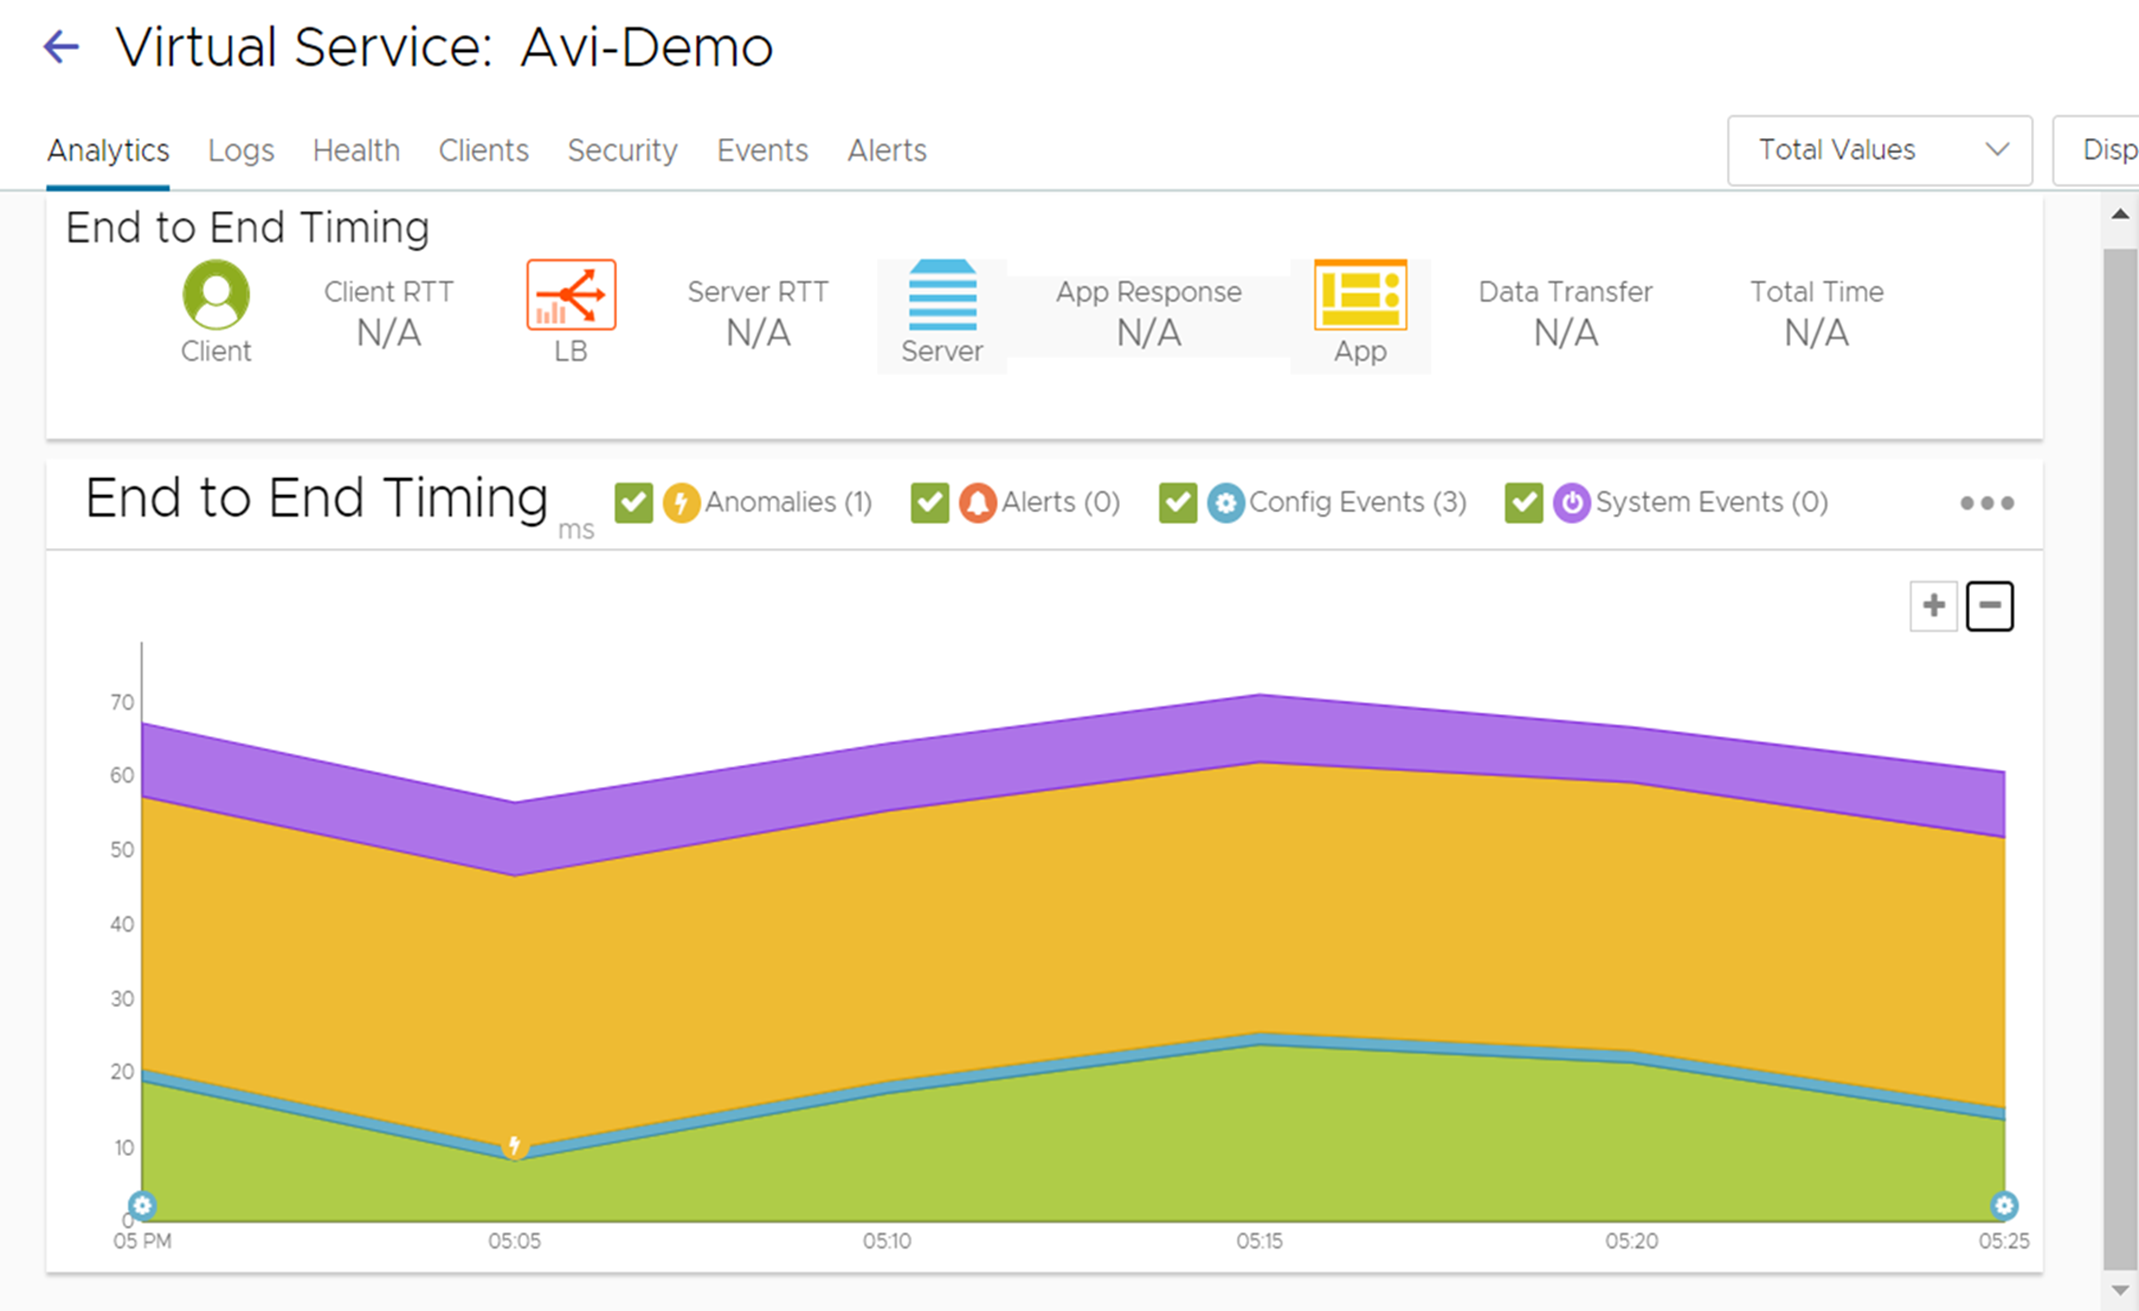
After the first 30 minutes, the aggressive metrics capture expires, and the SEs report metrics less frequently in 5-minute intervals. This method enables richer troubleshooting data during the initial testing of the new application deployment. After an application is successfully deployed, analytics for the application cannot be viewed again for days, months, or a longer period. With larger deployments incorporating potentially hundreds or thousands of applications, the Avi Load Balancer attempts to reduce noise and conserve resources on the Controllers by capturing data less aggressively when not required.
Solution for Slowdown of Updates
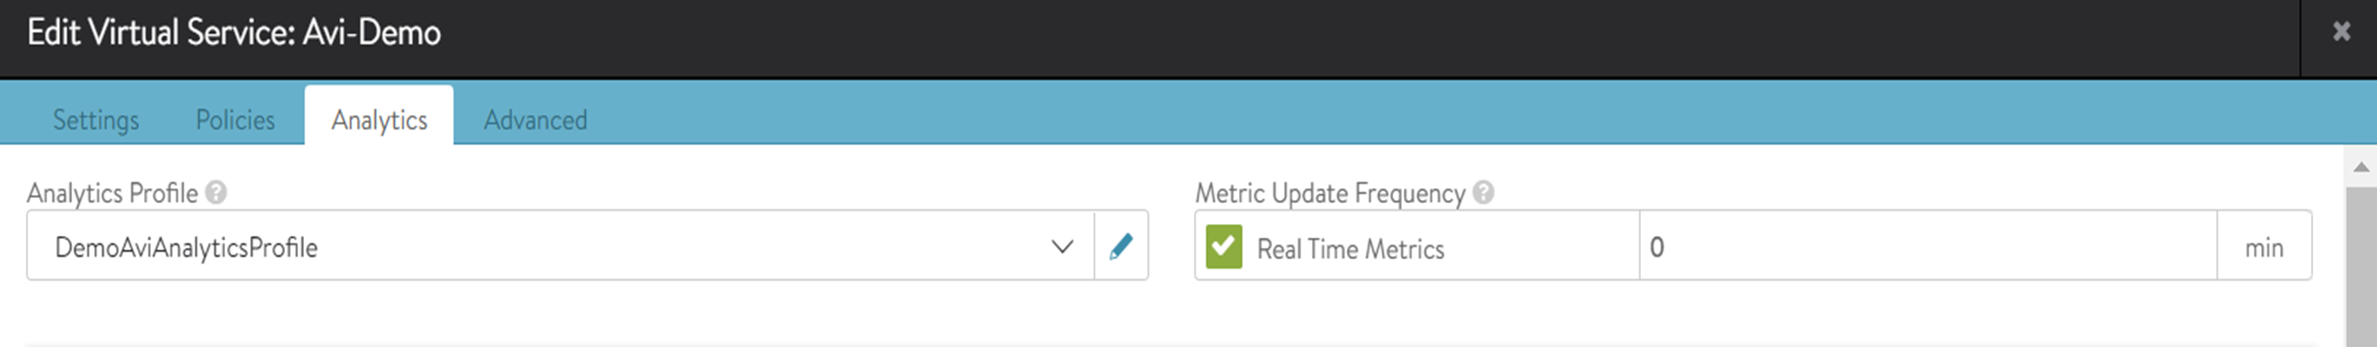
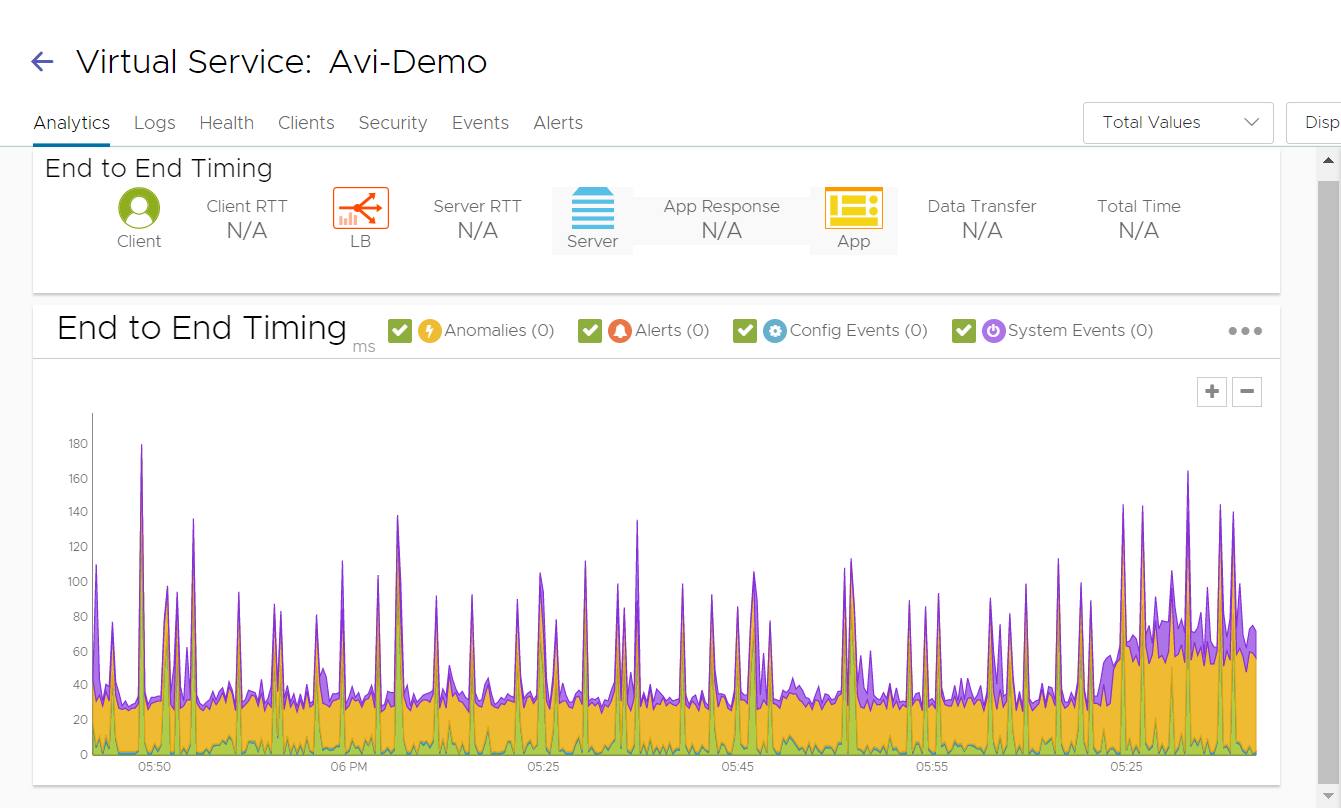
For high-priority applications or ones that require more detailed data, edit the virtual service and navigate to the Analytics tab. Select the Metrics Update Frequency check box and set the time to 0 (unlimited). This will permanently enable the capture of real-time metrics for the application. If a time other than 0 is specified, metrics collection reverts to the less aggressive interval upon expiration of the timer.
