This section explains the logs and sections of log entries.
To access the client logs for a virtual service:
Navigate to .
Click a virtual service name.
Click Logs.
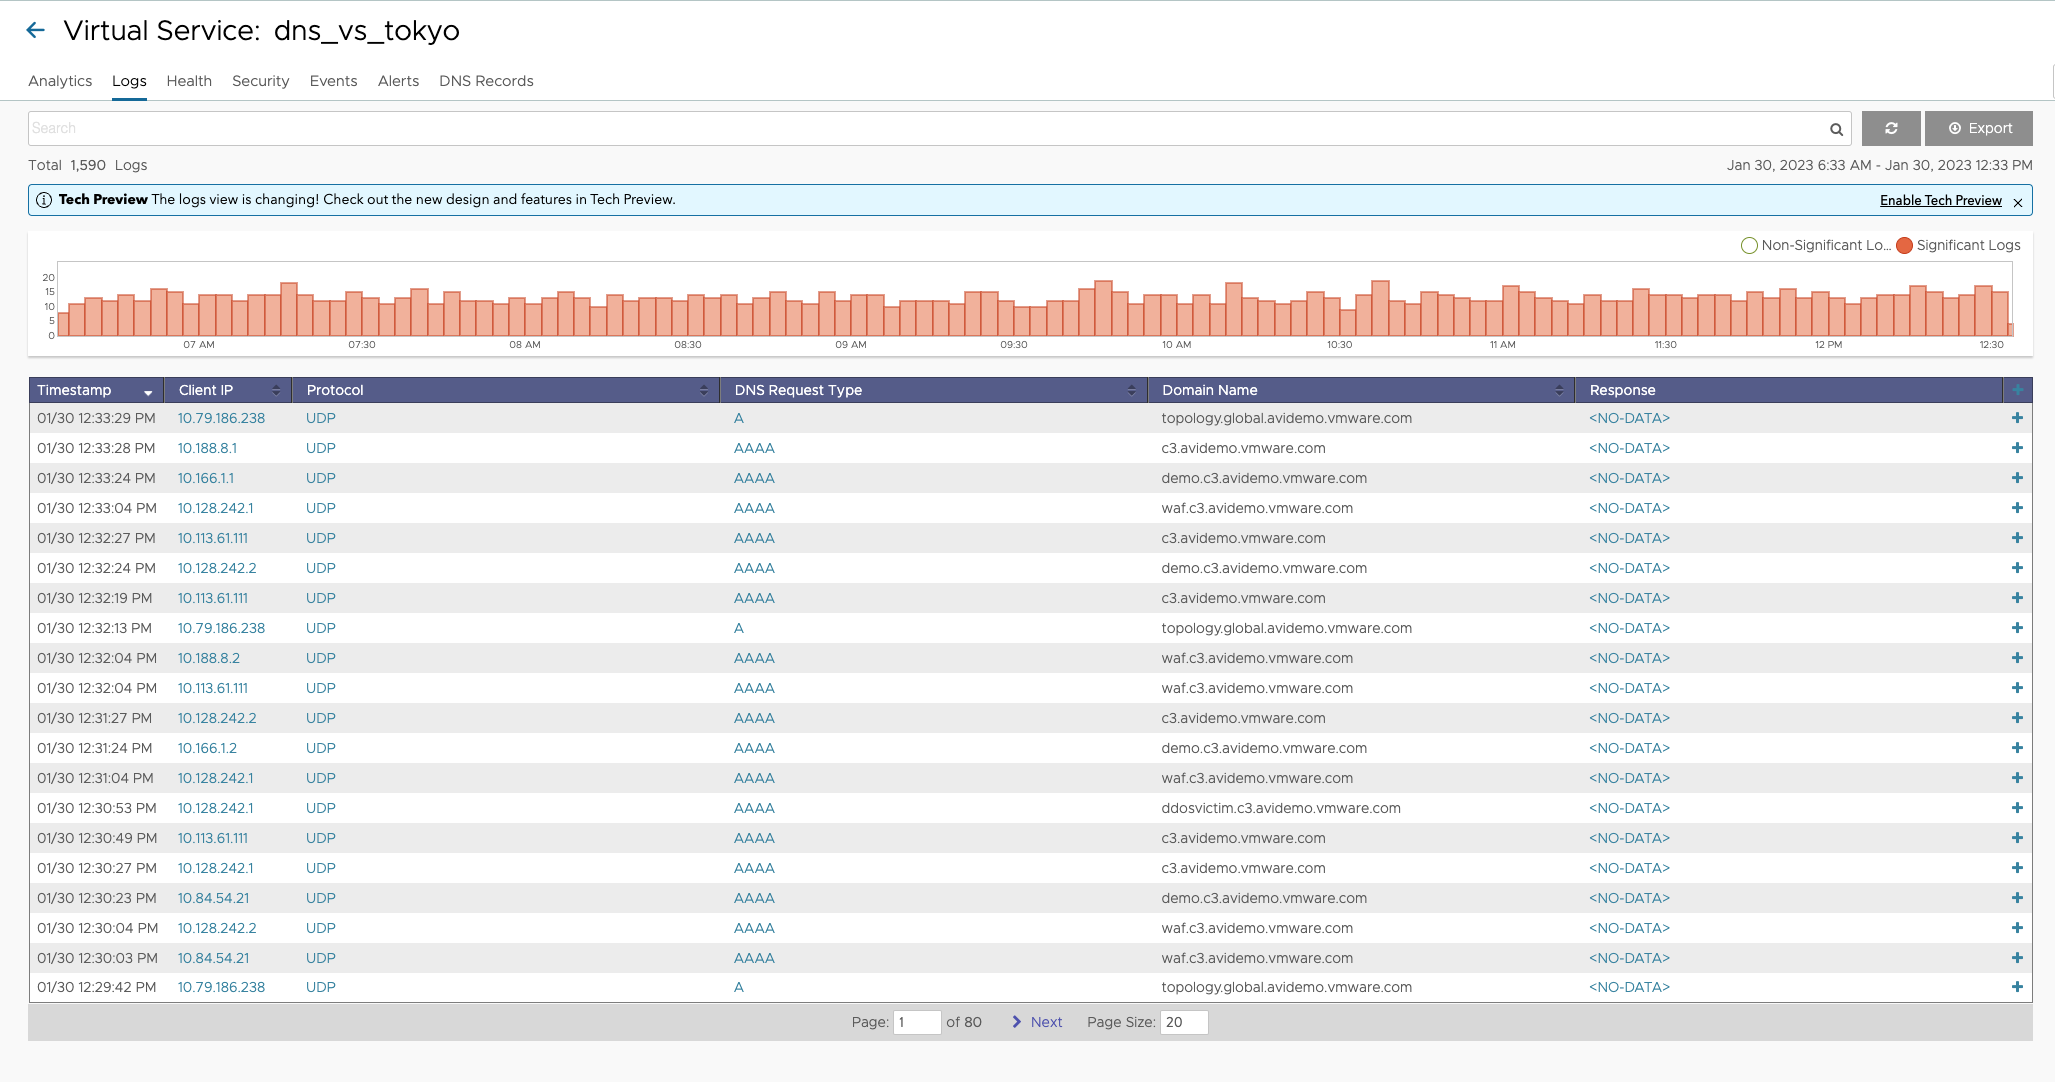
The old log view is visible by default. You can revert to the updated view from My Account Settings.
To go back to the new log view, click Enable Tech Preview, the following screen is displayed:
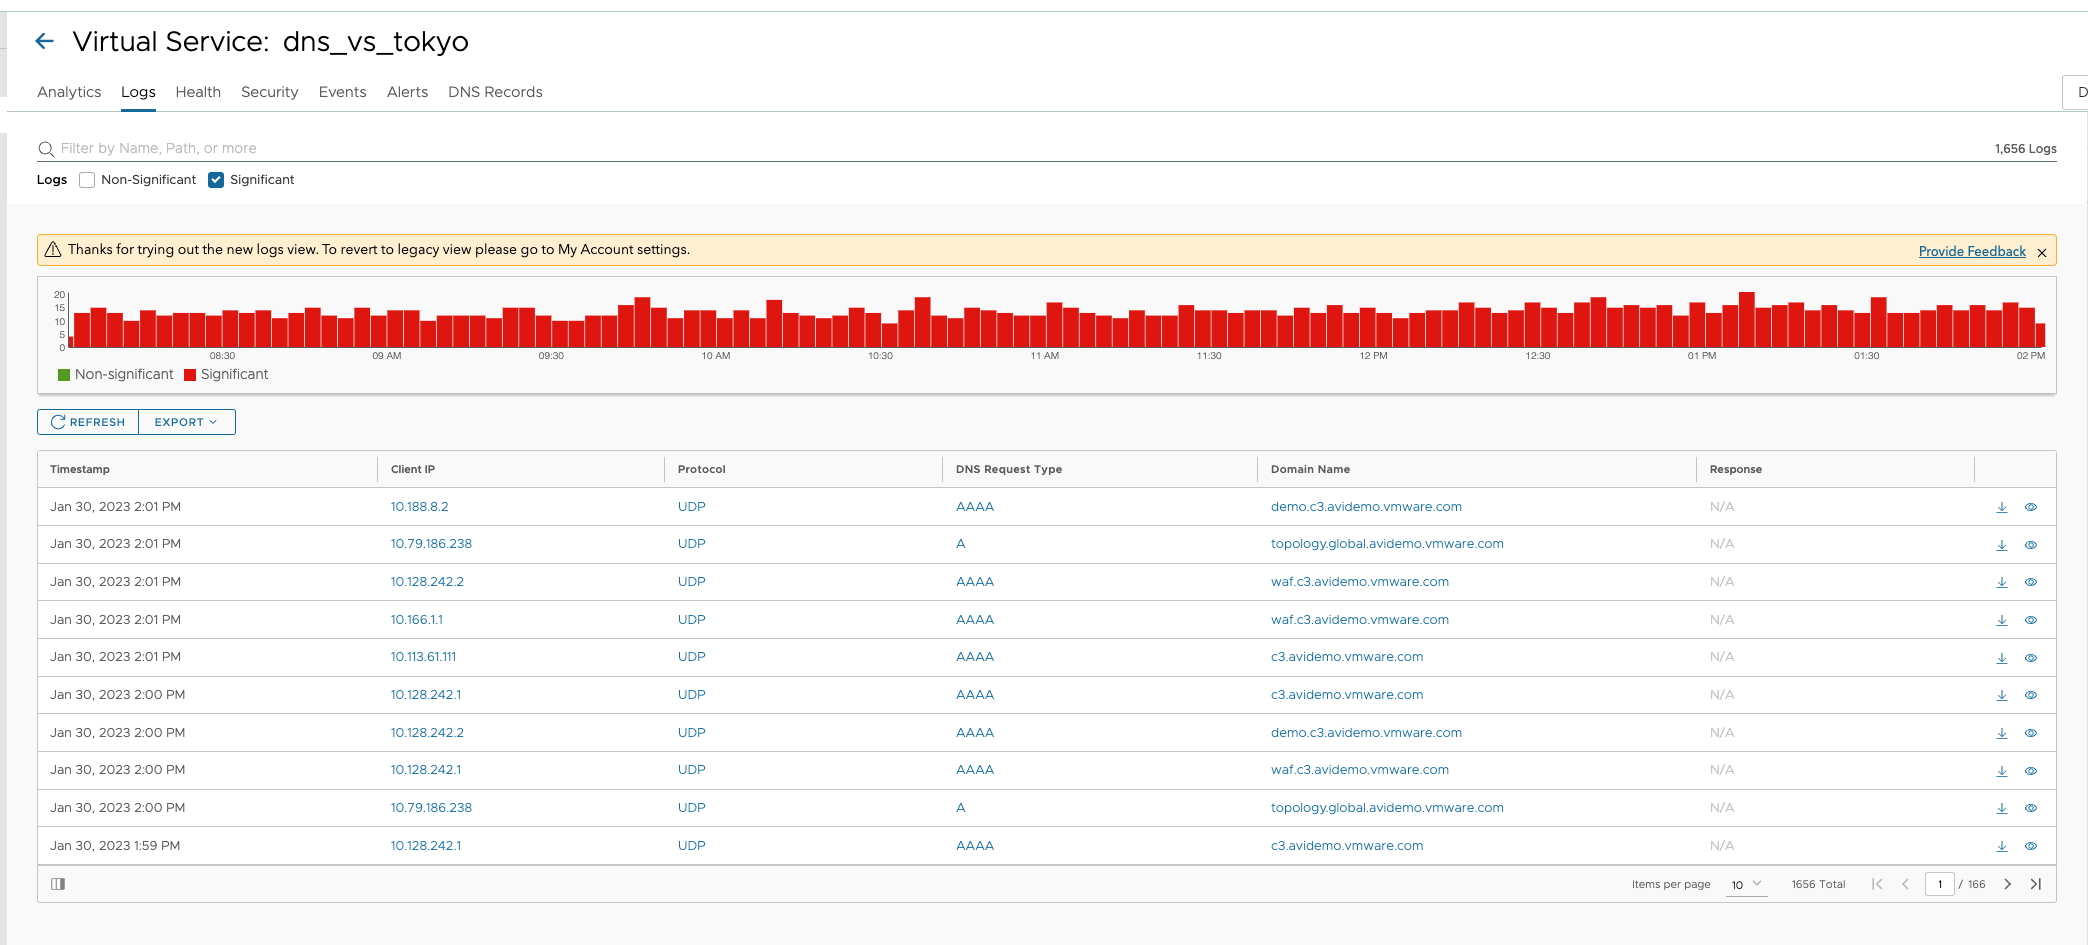
The Client Logs tab displays the following items:
Name |
Description |
|---|---|
Search |
Allows you to filter the log entries using free-form text, keywords or a formal search syntax. |
Export |
Downloads up to 10,000 logs in CSV format. |
Refresh |
Updates the logs for the selected time. |
Items per page |
The total number of log items being displayed. The date/time range of those logs appears beneath the Search field. The number will reflect how many logs passed the filter. |
Clear Selected |
If one or more filters have been added to the Search field, click the grayX icon near the search bar to remove those filters. To clear individual filters, click the white on the blue X for that filter. |
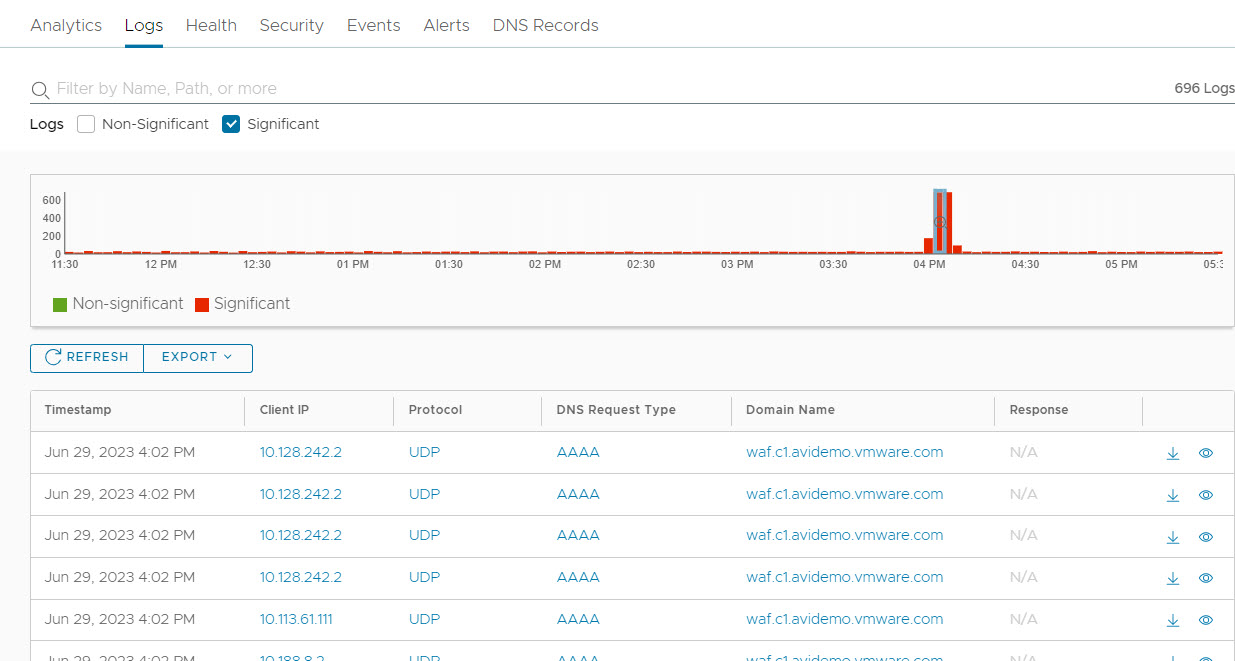
Histogram |
Shows the number of client log entries over the selected time.
|
Click and drag inside the histogram to refine the date/time which further filters the logs.
Clicking the magnifying glass icon in the drawn box will zoom the Histogram to that view. This expands the drilled in time to zoom in to the width of the Histogram, and also changes the Displaying Time drop-down menu to Custom. To return to the previously selected period, use the Displaying drop-down menu.
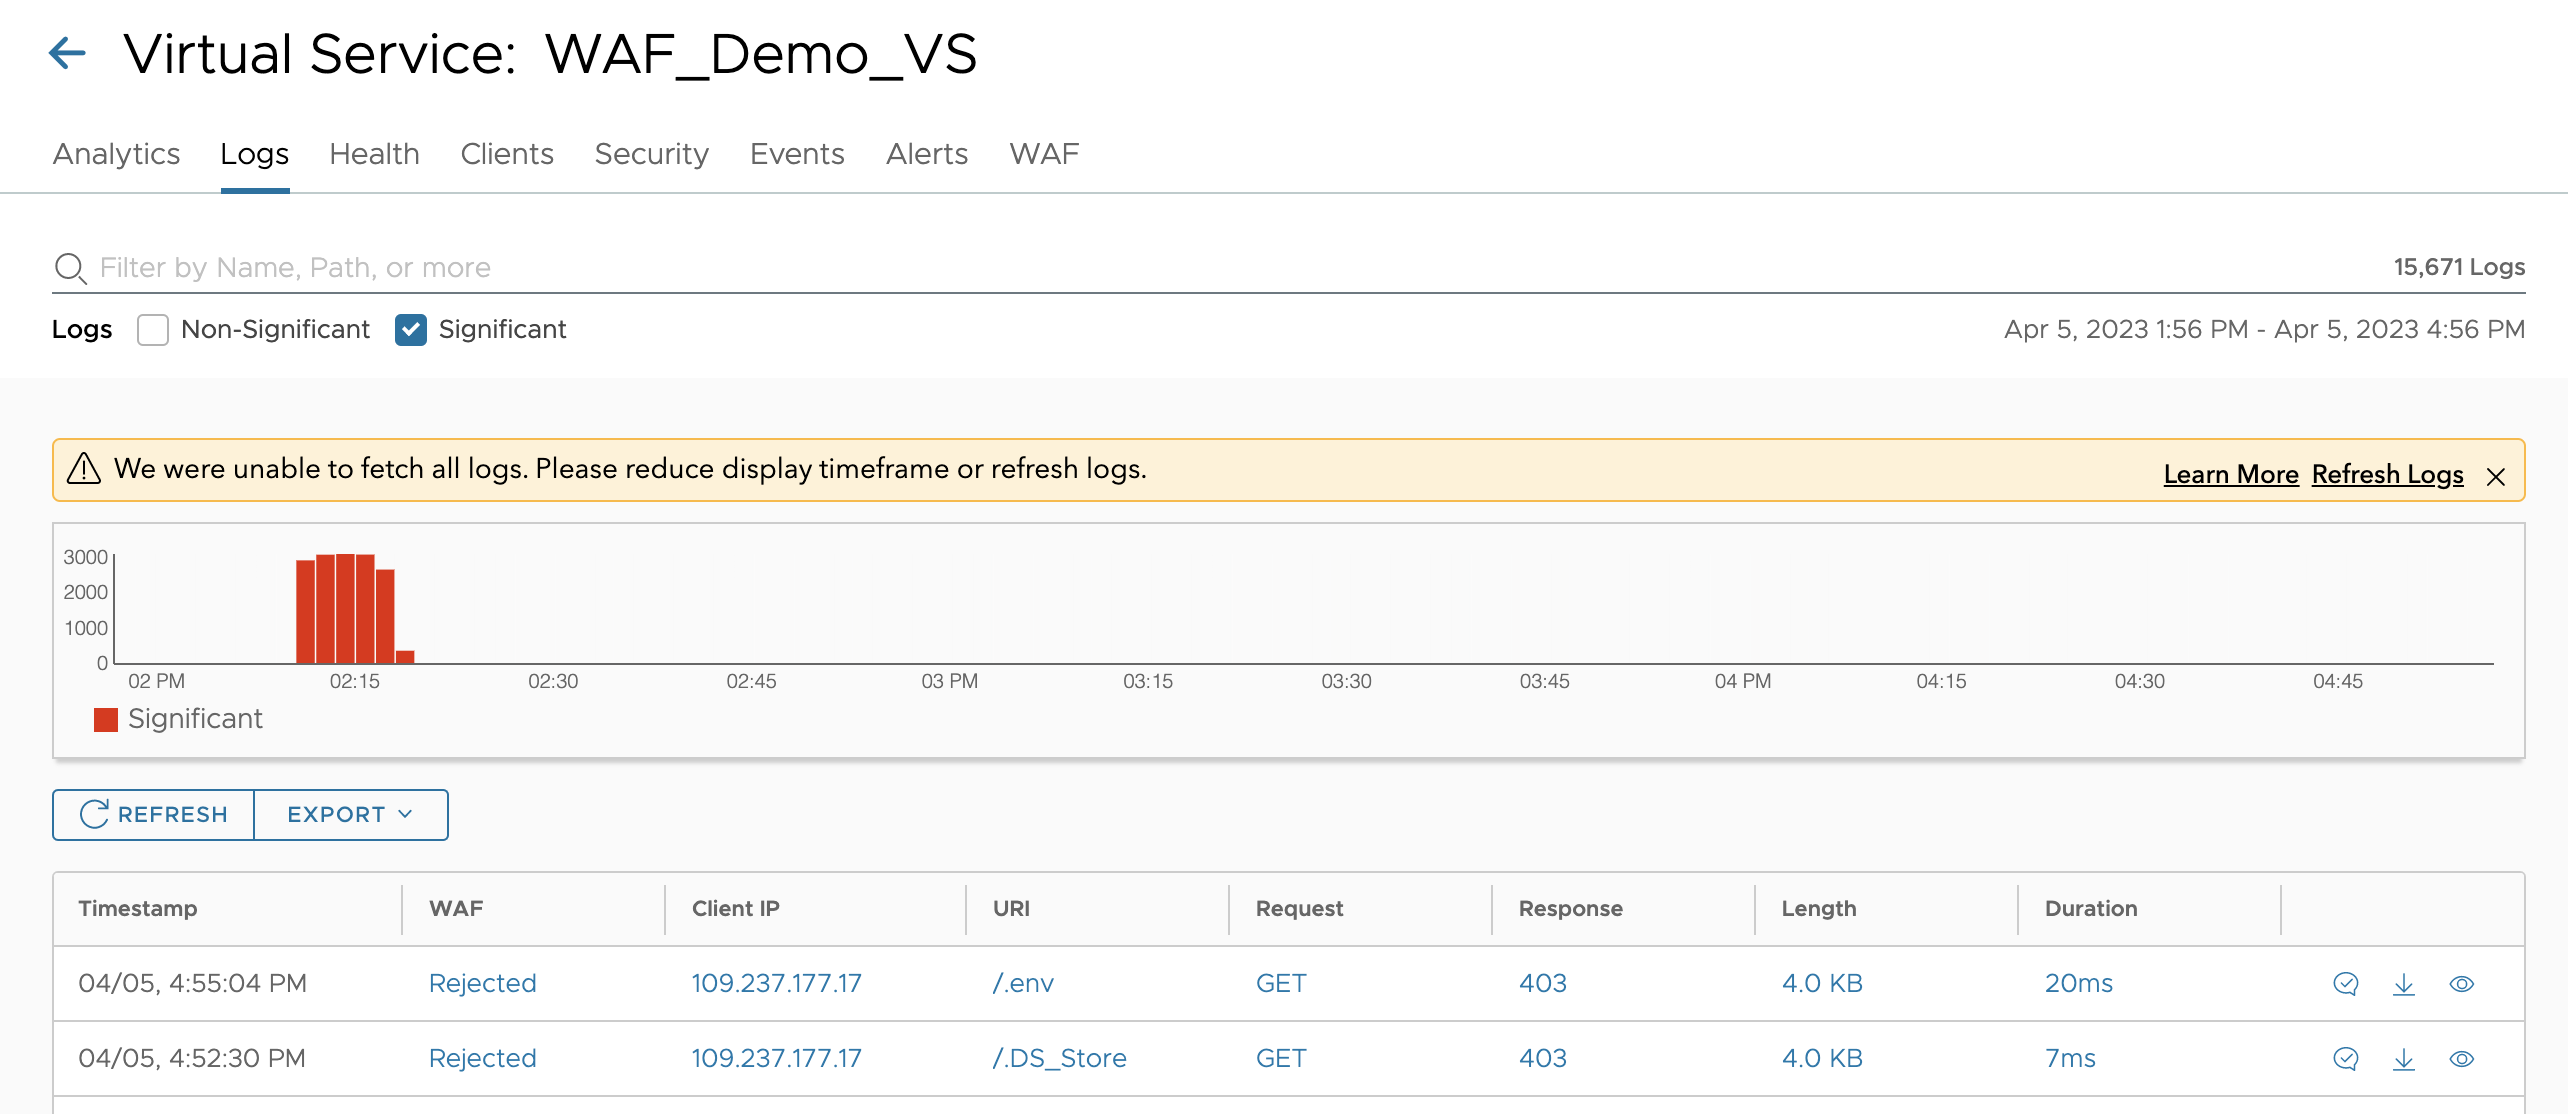
The primary table on the Logs tab displays the list of individual log entries as shown below:
Field Name |
Description |
|---|---|
Timestamp |
Date and time of the event. |
WAF |
WAF status, such as, Passed, Flagged, Rejected or By Passed. |
Client IP |
The source IP address of the client to which the log entry applies.
Note:
Client IP is subject to the option Use_True_Client_IP. Client IP can be equal to the source IP from the layer-3 header or equal to the fetched IP from the user-defined HTTP header. For more information, see True Client IP in L7 Security Features topic in the VMware Avi Load BalancerConfiguration Guide. |
URI |
For HTTP-enabled virtual services, the URI path of the request, such as /index.html. |
Request Type |
Type of HTTP method for the request, such as GET, POST, or HEAD. |
Length |
Size of the response, in Kilobytes. |
Response |
For HTTP, the response code will be of type 1xx, 2xx, 3xx, 4xx, or 5xx. This is usually a reflection of the response sent by the server, but it may instead be a response created by the Avi Load Balancer. Expand the log to determine whether the server or the Avi Load Balancer generated the response. |
Duration |
Bar shows the total transaction time, which can be used to compare this request to others based on the length of the bar. Hovering the mouse pointer over the bar shows a breakdown of time that makes up the duration of the request. This is a miniature version of the End to End Timing chart that appears when the log is expanded. Expands or collapses a view into logs. |
Timeouts: In the logs page, a timeout can occur, which means that the API has not returned all available logs data before a specified amount of time. You will see the following message: