


SE time flow tracker can track the network characteristics, processing time at critical checkpoints, and flag queuing delays in a packet journey through the network appliance.
Configuring Analytics Profile through CLI
The following are the configuration used in analytics profile.
> show analyticsprofile System-Analytics-Profile
..
| latency_audit_props                 |                           |
|   latency_audit_mode                | LATENCY_AUDIT_OFF         |
|   latency_threshold                 | 20 milliseconds           |
|   conn_est_audit_mode               | LATENCY_AUDIT_ON          |
|   conn_est_threshold                | 40 milliseconds           |
+-------------------------------------+---------------------------+
The audit properties are described below.
Audit Properties |
Default |
Description |
|---|---|---|
latency_audit_mode |
LATENCY_AUDIT_OFF |
|
latency_threshold |
20 msec |
This enables tracking the dispatcher to proxy latency for each packet if latency_audit_mode is set to |
conn_est_audit_mode |
LATENCY_AUDIT_ON |
|
conn_est_threshold |
40 msec |
This enables tracking the TCP connection establishment time if |
Currently, latency_audit_filters is supported only for TCP/IPV4.
Time Tracker is toggled off if the CPU Time Stamp Counter (TSC) is variant.
Time Tracker Latency Audit now supports auditing egress latency.
Configuring latency_audit_filters in Debug Virtual Service
The filters contain all the options offered by VS capture filters. However, latency_audit_filters are functionally independent of capture filters.
> debug virtualservice vs-1
..
[admin:vpr-ctrl1]: debugvirtualservice:latency_audit_filters>
cancel               Exit the current submode without saving
capture_ip           (submode)
capture_ipc          (submode)
do                   Execute a show command
dst_port_end         Destination Port range filter.
dst_port_start       Destination Port range filter.
eth_proto            Ethernet Proto filter.
ip_proto             IP Proto filter. Support for TCP only for now.
new                  (Editor Mode) Create new object in editor mode
no                   Remove field
save                 Save and exit the current submode
show_schema          show object schema
src_port             Source Port filter.
src_port_range_end   Source Port range end filter. If specified, the source port filter will be a range. The filter range will be between src_port and src_port_range_end.
tcp_ack              TCP ACK flag filter.
tcp_fin              TCP FIN flag filter.
tcp_push             TCP PUSH flag filter.
tcp_syn              TCP SYN flag filter.
watch                Watch a given show command
where                Display the in-progress object
Latency audit is now part of se_Group under se_time_Tracker_properties.
SE TT latency audit (ingress/egress) is now independent of flow_type.
Latency_audit_filters under debug serviceengine are now deprecated.
The app log and connection log for TT latency_audit is still controlled by a knob under the analytics profile (the knob is ingress_sig_log). This is to allow log generation behaviour to be tweaked independently on each virtual service.
Connection establishment audit is part of analytics_profile > timetracker_properties. TimeTracker has the following two components:
se_time_tracker_properties (to audit SE-specific events and counters)
time_tracker_properties (to audit virtual service/ANP-specific events and counters)
To check the SE time tracker properties, use the se_time_tracker_props option under the configure serviceenginegroup <se_group_name> command. Below is the sample output for the SE time tracker properties.
| se_time_tracker_props                   |                                                         |
|   ingress_threshold                     | 4 milliseconds                                          |
|   egress_threshold                      | 4 milliseconds                                          |
|   ingress_audit_mode                    | SE_TT_AUDIT_ON_WITH_EVENT                               |
|   egress_audit_mode                     | SE_TT_AUDIT_ON_WITH_EVENT                               |
|   event_gen_window                      | 1 seconds                                               |
| grpc_channel_connect_timeout            | 15                                                      |
+-----------------------------------------+---------------------------------------------------------+
Use the configure analyticsprofile <profile_name> command and the time_tracker_properties option to check the time tracker properties for the selected analytics profile.
| time_tracker_props                              |                                                       |
|   fe_conn_est_audit_mode                        | TT_AUDIT_ON_WITH_SIG                                  |
|   fe_conn_est_threshold                         | 4 milliseconds                                        |
|   be_conn_est_audit_mode                        | TT_AUDIT_ON_WITH_SIG                                  |
|   be_conn_est_threshold                         | 4 milliseconds                                        |
|   ingress_sig_log                               | True                                                  |
+-------------------------------------------------+-------------------------------------------------------+
Below is the default values for the Time Tracker and SE Time Tracker properties.
se time tracker props |
(default) |
|---|---|
egress_audit_mode |
SE_TT_AUDIT_OFF |
egress_treshold_ms |
20 |
event_gen_window_secs |
300 |
ingress_audit_mode |
SE_TT_AUDIT_OFF |
ingress_treshold_ms |
20 |
time tracker props |
(default) |
|---|---|
be_conn_est_audit_mode |
TT_AUDIT_ON |
be_conn_est_treshold |
40 |
fe_conn_est_audit_mode |
TT_AUDIT_ON |
fe_conn_est_treshold |
40 |
ingress_sig_log |
false |
Metrics and Logs
The framework supports metrics, events, and logs which can be configured as follows:
Metrics at SE Level:
[Demo:10-79-187-243]: > show serviceengine AviDemoSE-se-lskff rteringstat | grep exceed
| num_ingress_latency_exceeded_pkts | 112465061                                             |
Metrics at Virtual Service Level:
[Demo:10-79-187-243]: > show virtualservice Avi-Demo internal | grep exceed
| num_ingress_latency_exceeded_pkts   | 1383747                                             |
| num_ingress_latency_exceeded_flows  | 184                                                 |
| num_conn_est_time_exceeded_flows_fe | 1035                                                |
| num_conn_est_time_exceeded_flows_be | 1035                                                |
Events:
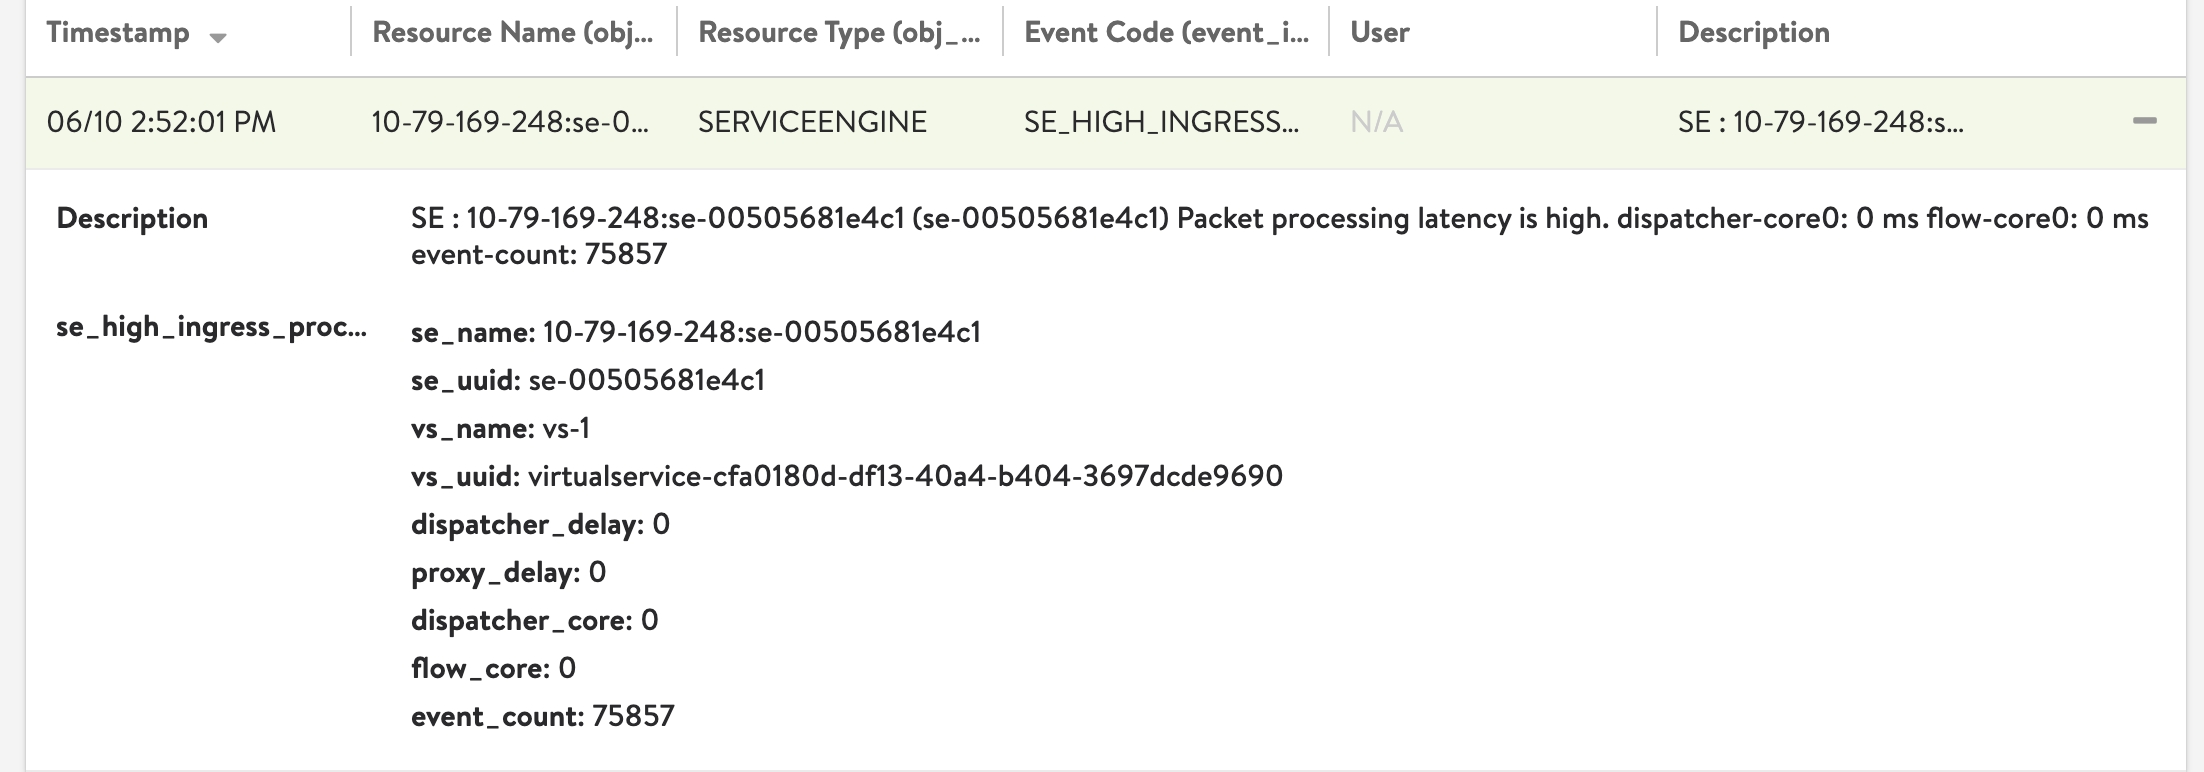
The threshold is set to 0 in this example.
Significant Logs (When Latency_Audit is enabled):
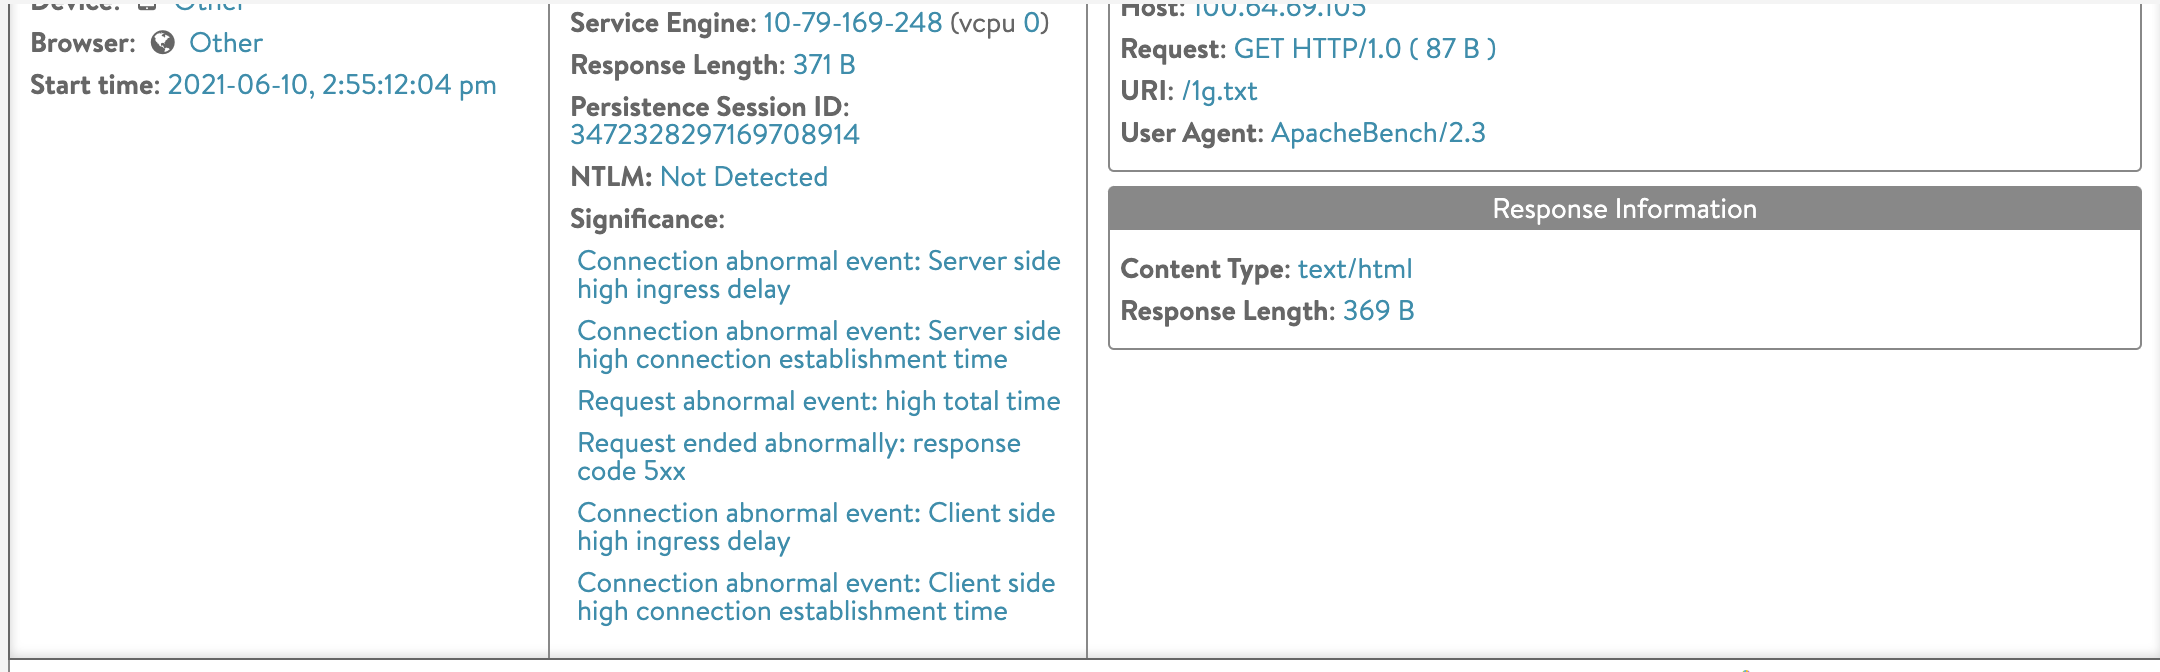
The detailed timing and flow characteristics will be present in the Connection/App Log.
The following are the changes introduced for the Events options in the Avi Load Balancer 22.1.1 version.
TT Event generation option is now configurable under se_timetracker_properties.
Virtual Service details are not supported under the Time Tracker Event.
The maximum value of the ingress/egress latency (within an event window) is now published on the event log.
Use the show serviceengine <SE_NAME> rteringstat command to check Service Engine RteRingstats for Time Tracker :
| num_ingress_latency_exceeded_pkts | 12                        |
| num_egress_latency_exceeded_pkts  | 12                        |
Use the show virtualservice <VS_name> internal command to check the virtual service internal statistics for Time Tracker :
| num_ingress_latency_exceeded_flows  | 2                                                   |
| num_conn_est_time_exceeded_flows_fe | 1                                                   |
| num_conn_est_time_exceeded_flows_be | 1                                                   |
