


This section explains how to view Preview logs and events for debugging WAF Signatures.
You can filter preview logs for a particular combination by clicking the Preview Logs button.
-
In the following example, the grayed out elements in the screenshot represent the filter elements that are selected.
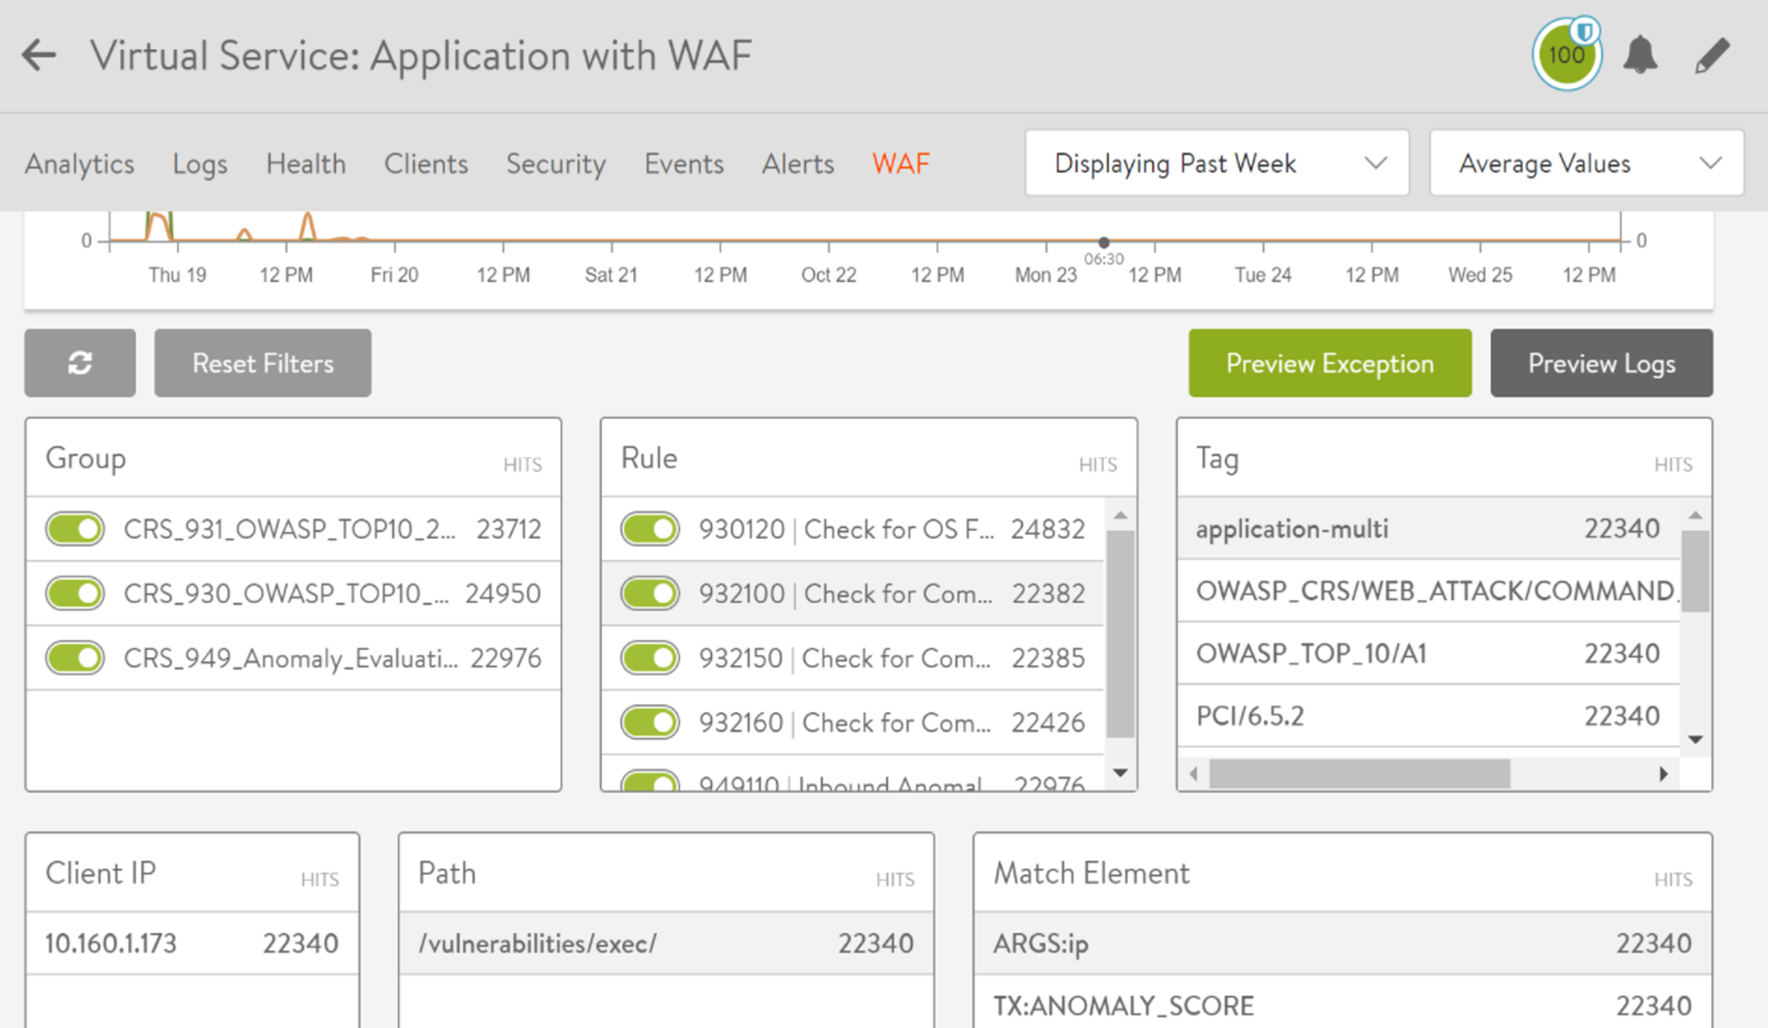
-
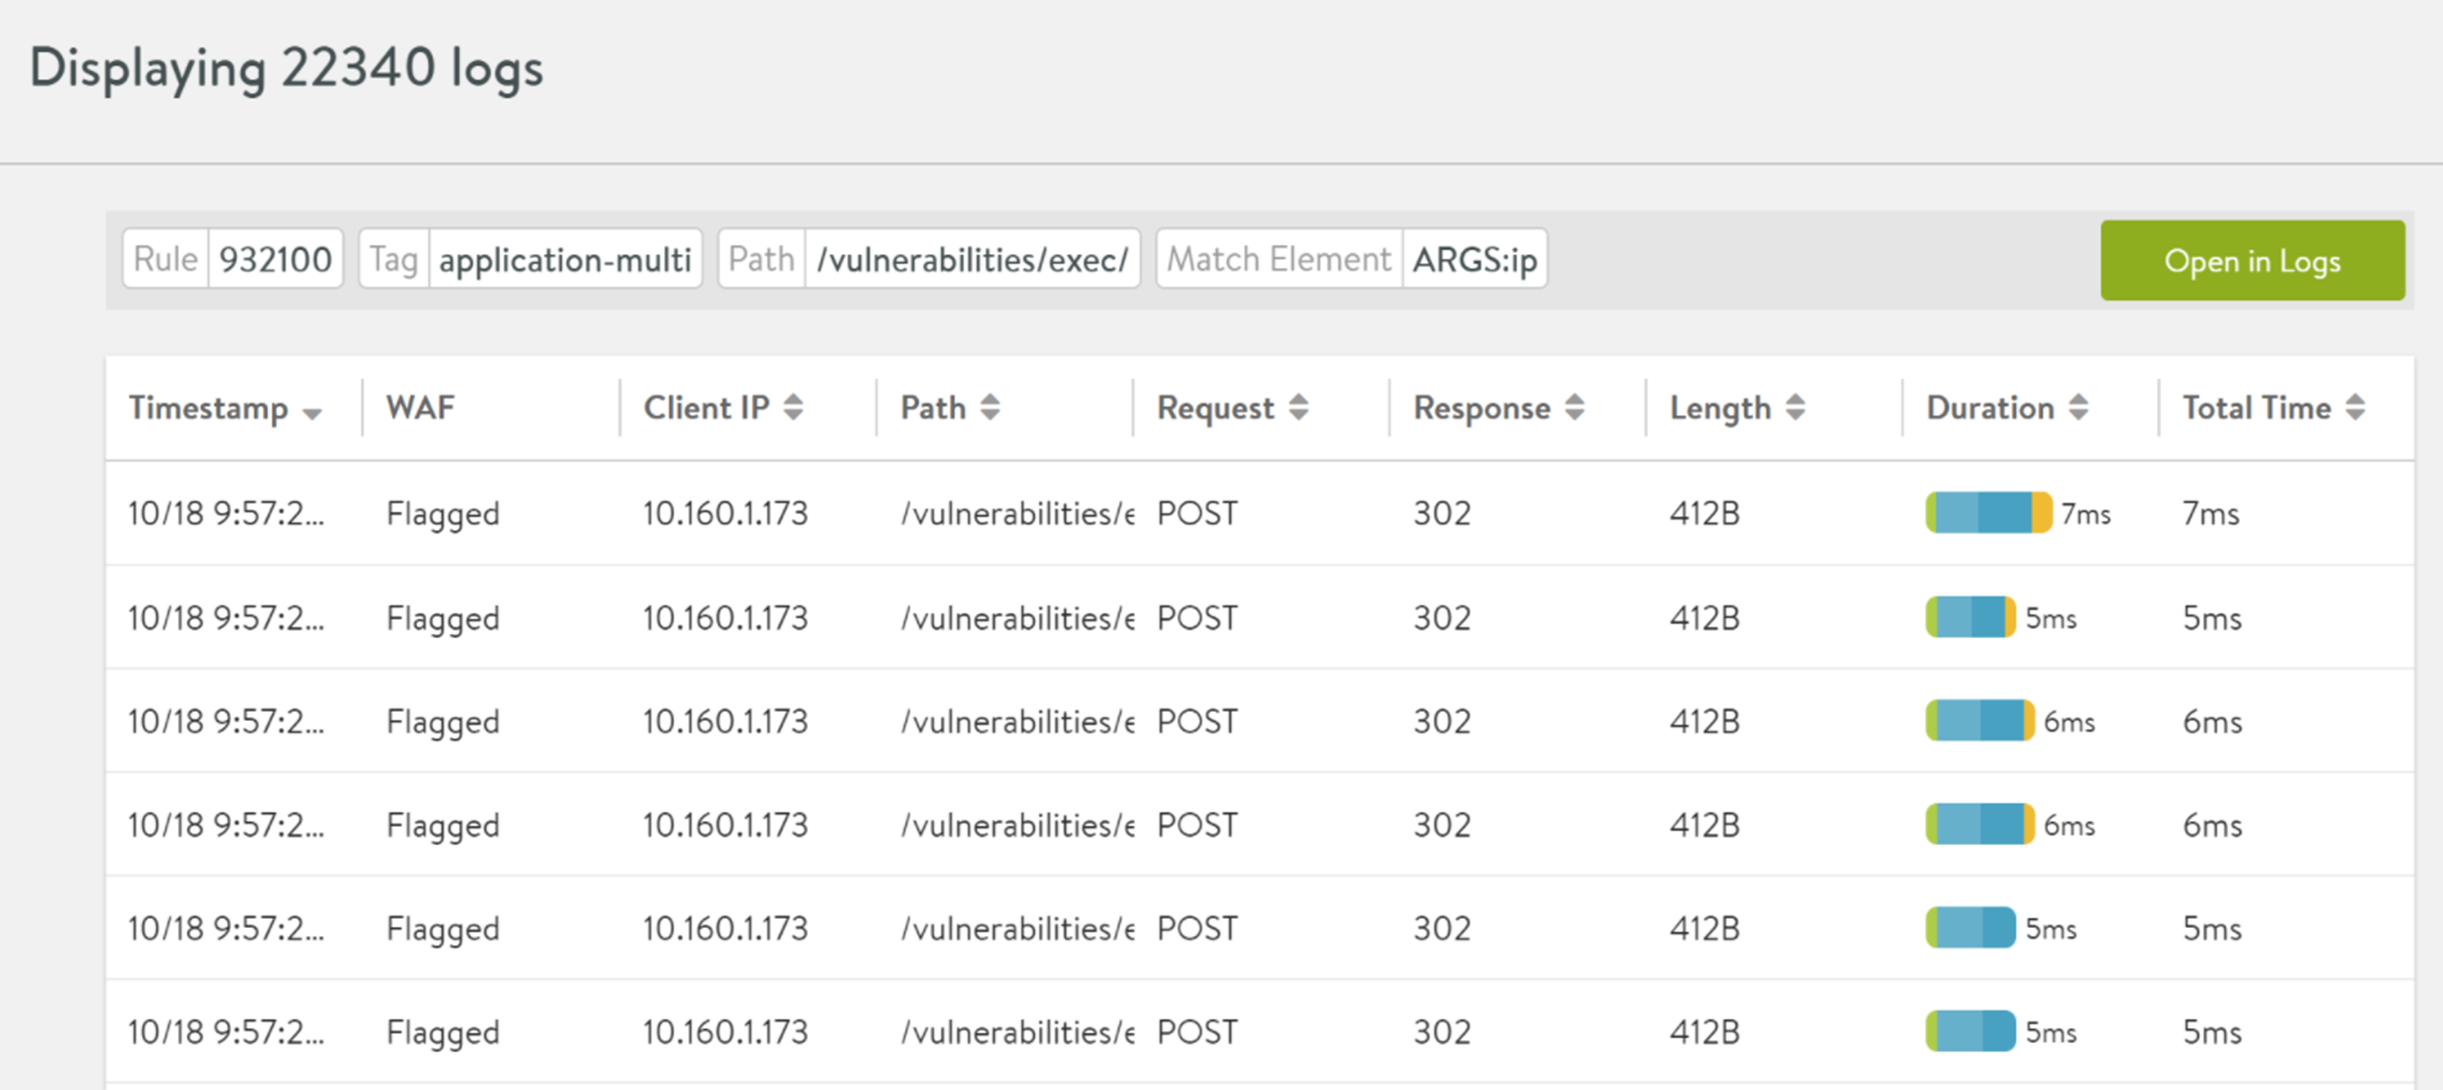
Click the Preview Logs button to view a log table as shown below.
For information on viewing events for debugging WAF Signature, see Virtual Service Events topic in the VMware Avi Load Balancer Monitoring and Operability Guide.
Note:
There can be few instances where WAF hits (Flagged) are not displayed in the WAF tab of the virtual service but when filtered for WAF, they are displayed under the Logs tab of the same virtual service. WAF hits not getting displayed in the WAF tab is an expected behavior, as WAF analytics dashboard uses log APIs with filter where all logs marked as internal are not displayed ( waf_log.rule_logs.matches.is_internal != True). It is possible that all of the WAF hits on VS Logs do not match this filter, and so no data is shown on the WAF dashboard.
