You can view the ROI Details in VMware BMA.

To view ROI Details in VMware BMA:
  1. Click Dashboard > ROI.
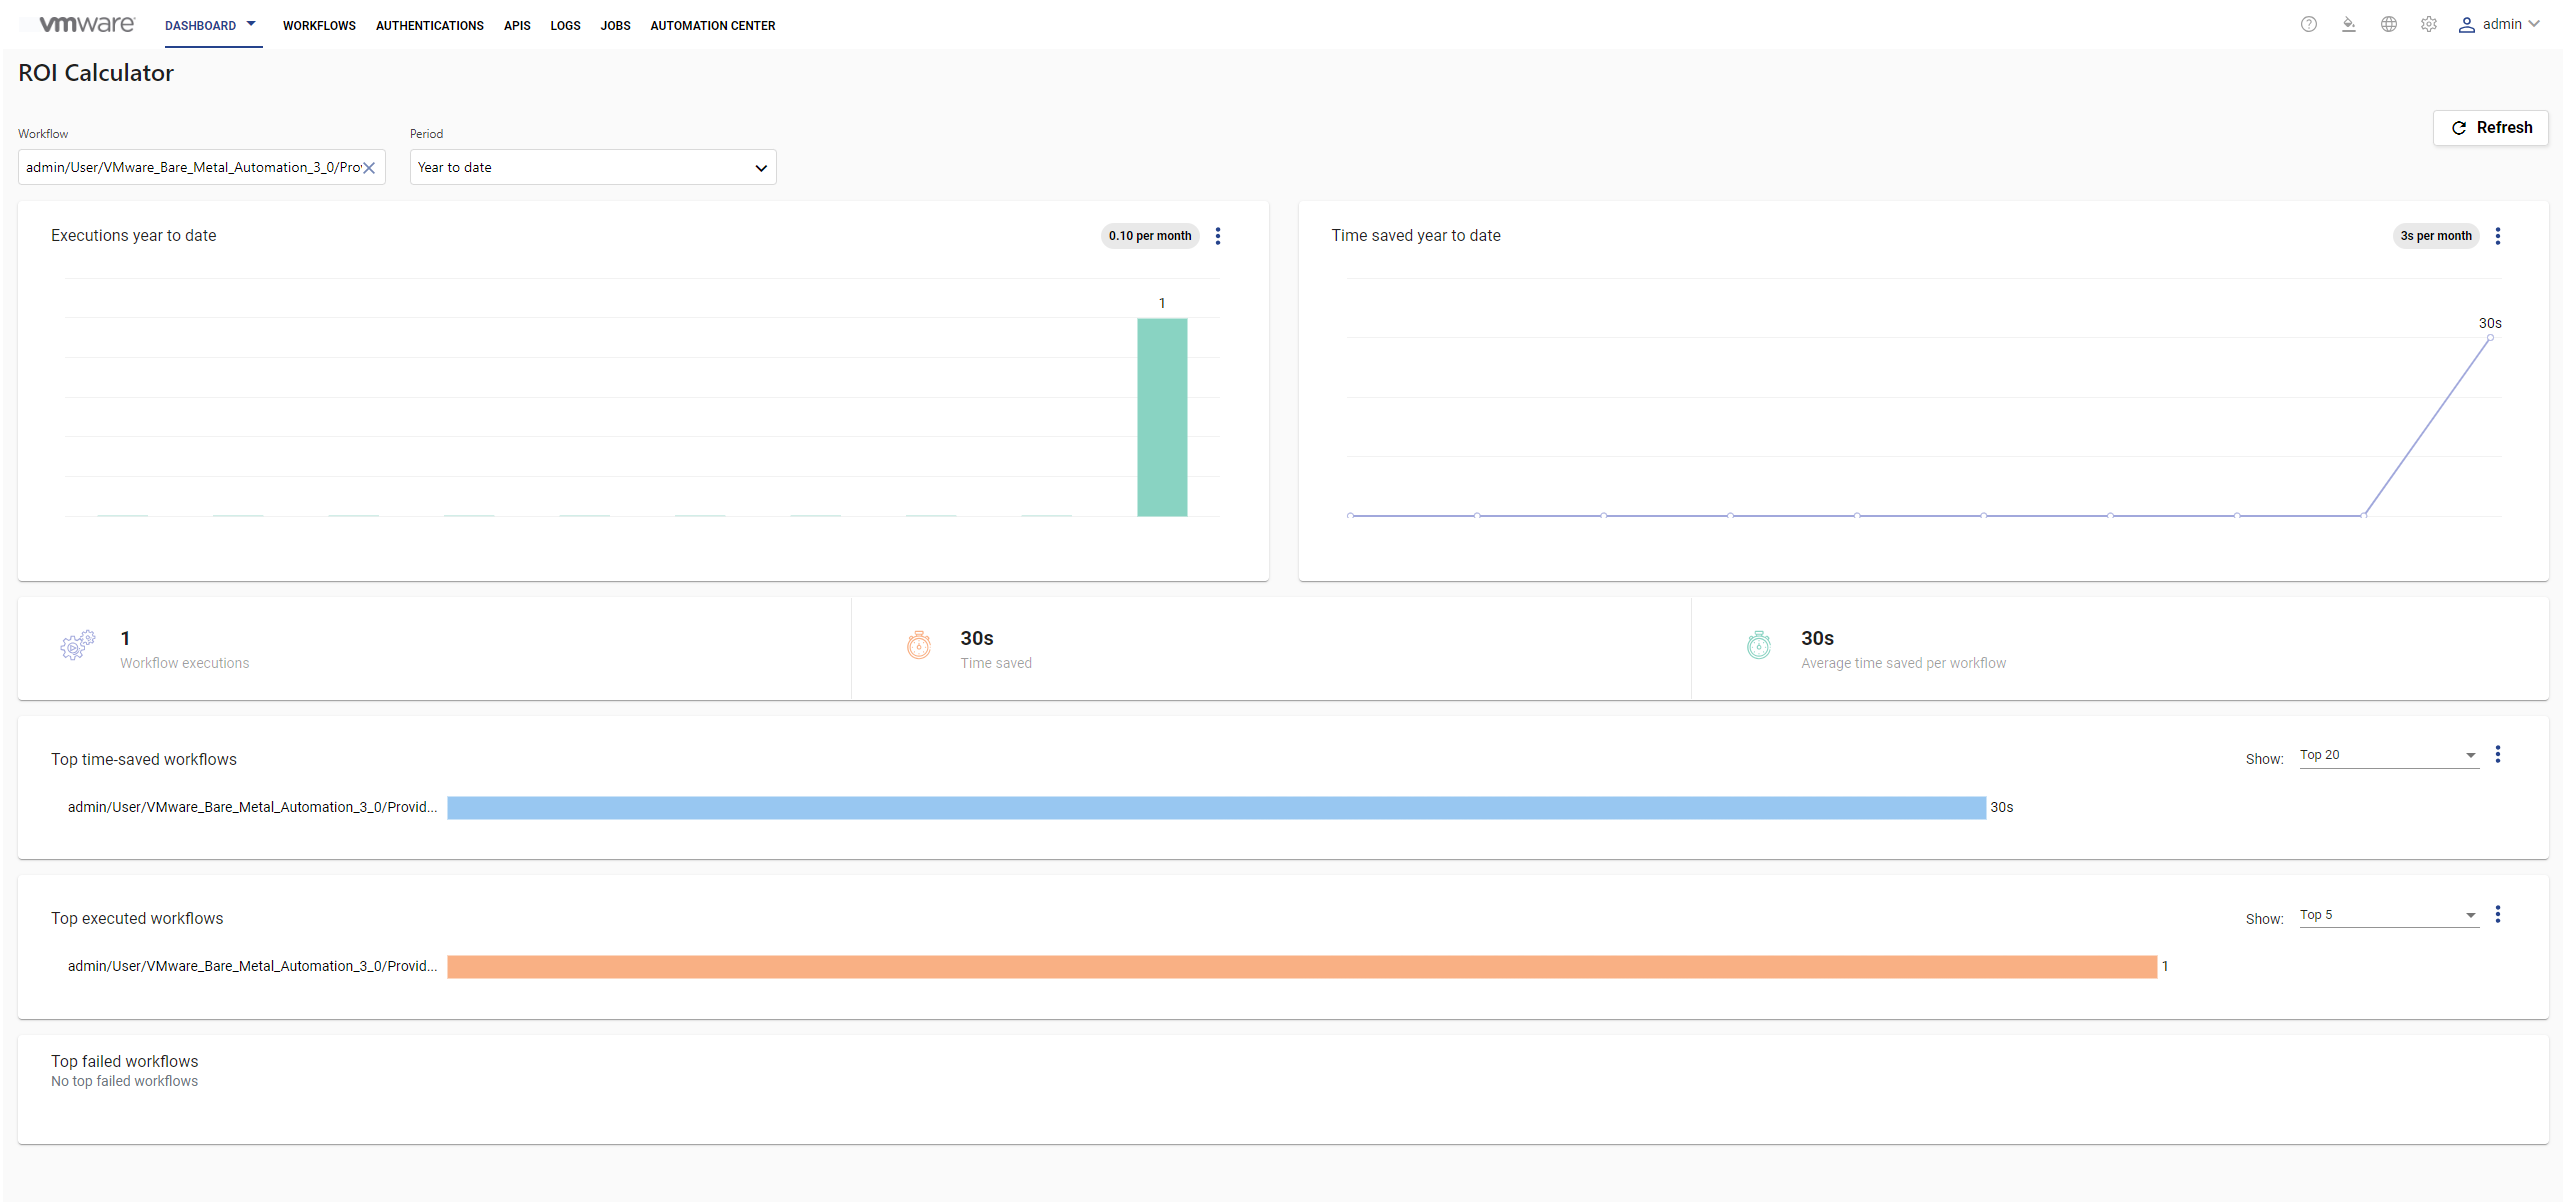
You can view the following details in the ROI window:
  • Number of workflow executions in the selected period.

    The graph includes an average calculation and is split into bars representing the hours of the day, days of the week, or days of the month.

  • Time saved by executing the workflows.

    The graph includes an average calculation and divides the selected period into individual time windows.

  • Number of executions in the selected period
  • Total time saved.
  • Average time saved.
  • Top time-saved workflows.

    You can view the top 5, 10, 15, or 20 time-saved workflows.

  • Top executed workflows.

    You can view the top 5, 10, 15, or 20 executed workflows.

  • Top failed workflows.

    You can view the top 5, 10, 15, or 20 failed workflows.
Procedure

  1. In the ROI dashboard, browse and select the workflow for which you want to view the details.
  2. Select the time period for which you want to view the workflow execution details.
    Note: The default time period is Today. The ROI details appear for the current day by default.
    The workflow execution details appear.

  3. To download the list of workflows executed in the selected period, click the ellipsis icon () next to Executions last <period> pane and select the format.
  4. To download the list of time-saved workflows in the selected period, click the ellipsis icon () next to Time saved <period> pane and select the format.
  5. To download the list of the top time-saved, top executed, or top failed workflows, click the ellipsis icon () next to the required option and select the format.
    You can select the number of workflows you want to view from the drop-down menu.