


The CBPTest Tool - Disk Performance Testing Tool measures storage performance using access patterns that closely resemble those for SQL Server when used by the App Control Server.
The following metrics are measured:
- Sequential Writes: Measured as throughput in MB/s of sequential writes with block size of 64 KB, and no outstanding requests (raw IOPS using a single level of parallelism).
- Random Reads: Measured as throughput in MB/s of random reads with block size of 8 KB, and 4 outstanding requests.
- Random Writes: Measured as throughput in MB/s of random writes with block size of 8 KB, and 32 outstanding requests.
Required Performance Metrics
The following table describes the metrics that the storage must meet in order to support different numbers of endpoints. For storage to meet App Control requirements, its metrics must be equal or above the number in the table in each category.
| Max Endpoints | Test Metrics (MB/s) | ||
|---|---|---|---|
| Sequential Writes | Random Reads | Random Writes | |
| 0 – 500 | 5 | 5 | 5 |
| 501 – 1,500 | 12 | 10 | 25 |
| 1,500 – 2,000 | 12 | 10 | 40 |
| 2,000 – 5,000 | 25 | 15 | 40 |
| 5,001 – 10,000 | 50 | 25 | 60 |
| 10,001 - 40,000 | 250 | 30 | 60 |
| 40,001 - 80,000 | 250 | 60 | 120 |
| 80,001 - 160,000 | 250 | 120 | 240 |
Test Prerequisites
- The System needs 60 GB of free space on the drives tested.
- Test requires .Net Framework 4.5 or newer to be installed on the system. Note that many Windows OS versions already come with version 4.5 or later pre-installed. If you are running this test from an older OS (older than Windows 7 or Windows Server 2008 R2), you can download this installer from the official Microsoft web site: http://www.microsoft.com/en-us/download/details.aspx?id=30653
- Test requires approximate 30 minutes to run.
- Tool Preparation:
- Download CbPTest-v3.zip from the User Exchange.
- Unzip CbPTest-v3.zip on the App Control server.
Note: Both files must be in the same folder in order for the test to run correctly.
The folder contains two files:
File Hash cbptest-v3.ps1 SHA256 - 3e6a31d1fd54167a7f718dbb2b1ae1fc10b83a87d404aa305469528acfac8fc1diskspd.exe SHA256 - e45f8f85fd7ab783251c987d763bbec42b0431fee633d5635f696aa0bc61baee
Running the CBPTest Tool - Disk Performance Testing Tool
- In an Admin PowerShell window, navigate to the folder containing the unzipped test files and type
cbptest-v3.ps1. - Specify the disk to test and the number of the drive to test.
A prompt displays the time estimate of the test.
Note: You can type Ctrl+C to abort. - The test results display at the end of the command in the PowerShell window. Please copy the results to your Carbon Black Technical Services Consultant for validation.
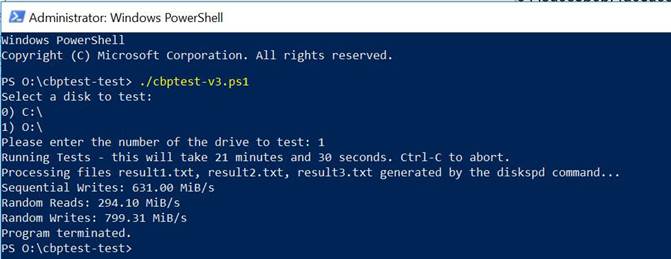
Example Test Output:
How to interpret the output from CBPTest
After running the CBPTest Tool - Disk Performance Testing Tool, the following three log files are created:
- result1.txt
- result2.txt
- result3.txt
- The Sequential Writes result is 631.00 MiB/s.
- The Random Reads result is 294.10 MiB/s.
- The Random Writes result is 799.31 MiB/s.
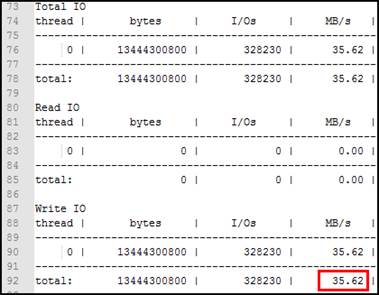
- Open result1.txt, in a text editor such as Notepad.
- Scroll down and look for the total MiB/s number under "Write IO". This is the Sequential Writes result.
The following image is an example of the output:
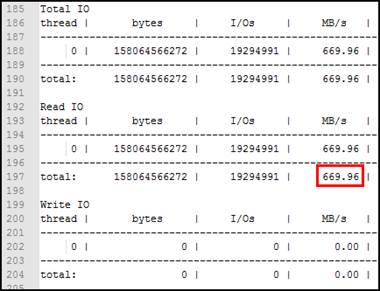
- Open result2.txt in a text editor. Navigat to the total MiB/s number under "Write IO." This is the Random Reads result.
The following image is an example of the output:
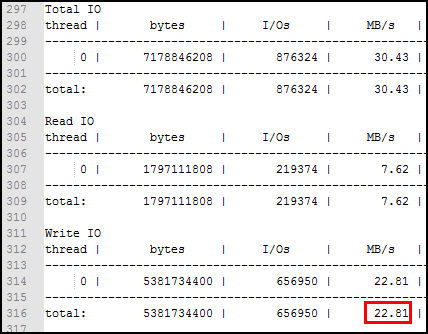
- Open result3.txt in a text editor. Navigate to the total MiB/s number under "Write IO" on line 316. This is the Random Writes result.
The following image is an example screenshot:
- Compare the results to the requirements listed on Required Performance Metrics.
In the example shown in the previous steps, the storage is capable of supporting an App Control instance with up to 2000 endpoints, with "Sequential Writes" being the limiting factor.
