


You configure three elements of the analytics features in the Carbon Black App Control Console.
- On the System Configuration page External Analytics tab, you specify the location, content, and size limitation (if any) for folder into which Carbon Black App Control data is exported.
- On the same tab, you can provide URLs and query specifications so that console users can link to specific reports on an external analytics server.
- On the Add Custom Rule page, you can create a rule that will ignore files written to the data export directory to reduce the impact of data exports on the Carbon Black App Control Server. See Add a Custom Rule to Ignore Analytics Log Files.
To accomplish the first two tasks on this list, perform the following procedure.
Procedure
- In the Messages fields, specify what type of information you want to export:
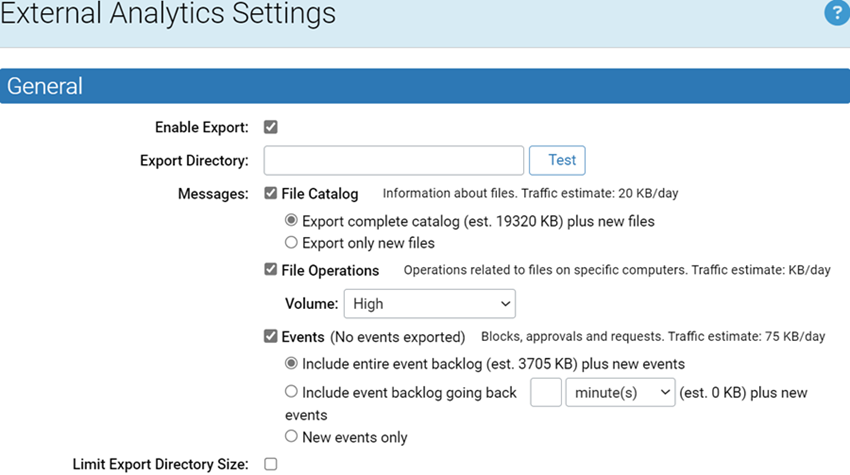
- File Catalog – Check this box to export File Catalog data to the export directory. Checking the box displays two radio buttons: Export complete catalog exports the entire current contents of the File Catalog and any new additions to the catalog. Export only new files exports only unique, new files discovered on agents reporting to your Carbon Black App Control Server once this option has been enabled.
- File Operations – Check this box to export messages from agents about operations that affect files. A dropdown menu lets you determine the volume, and by extension the type, of the data that is exported. See the External Analytics Configuration Options table for details.
-
Events – Check this to export Carbon Black App Control events. See the External Analytics Configuration Options table for details about the radio button options that control the amount of Event data that is exported and display the estimated size of the export where available.
When setting these Message export options, consider the traffic estimate values shown for each one and any traffic limits on the external analysis device. However, also be sure you are exporting enough data to allow for useful analysis.
Table 1. External Analytics Configuration Options Field/Button
Description
Enable Export
This checkbox activates and deactivates the External Analytics integration features, including data export and links to external analytics tools.
Export Directory
This field determines the directory to which the Carbon Black App Control Server exports data for external analysis. The Test button allows you to confirm that the directory is valid and that the server process has write access to it. The test results appear next to the button (either OK for success or a message explaining why the test failed).
Messages:
File Catalog
This checkbox enables export of File Catalog data to the export directory. Checking the box displays two radio buttons that control the amount of File Catalog data that is exported:
- Export complete catalog – This option exports the entire current contents of the File Catalog and continues exporting any new additions to the catalog.
- Export only new files – This option exports only unique, new files discovered on agents reporting to your Carbon Black App Control Server.
Messages:
File Operations
This checkbox enables export of messages from agents about operations that affect files. A dropdown menu lets you determine the volume, and by extension the type, of data that is exported:
- Low – Export messages about file Create, Modify, Delete, Rename, and Rename Directory operations.
- Medium – Export all messages in Low plus messages about file state changes (Approved, Unapproved, Banned); this includes both individual file state changes and operations that cause state changes in groups of files.
- High – Export all file operations messages.
Messages: Events
This checkbox enables export of Carbon Black App Control events data. Checking the box displays radio buttons that control the amount of Event data that is exported, and displays the estimated size of the export where available:
- Include entire event backlog (est. value KB) plus new events – This exports the entire existing event database and enables ongoing export of new events.
- Include event backlog going back [time value] (est. value KB) plus new events – This allows you to choose a time period of past events (starting from the present) to export and enables ongoing export of new events beginning when this is enabled.
- New events only – This enables ongoing export of new events only beginning when this setting is enabled.
Limit Export Directory Size
Checking this box displays a field in which you can enter the number of gigabytes of data to set as the maximum export directory size (i.e, the total size of all files in the Export Directory). When the limit is reached, files are deleted by age (oldest first) until the directory size is under the limit. The lowest allowable size limit is 3 GB. The current files in each category are never deleted.
Root URL
The root URL (optionally including the port) entered here points to the analytics server with which you are integrating the Carbon Black App Control Server. This is used as the base URL for links from Carbon Black App Control Console pages back to reports on the analytics server.
The Carbon Black App Control Console user must have credentials to log into the external server, and the URL provided must allow the user to log in with those credentials, even when using the Carbon Black App Control Console to reach it.
File Details Report
This defines a link to a File Investigation report on the analytics server. There are two fields to define the line: Relative URL, which is appended to the Root URL you define, and Query String, which defines the report you want from that URL.
When defined, this File Analytics link appears in the External Pages menu on the File Details and File Instance Details pages.
Click the Test button to the right of this line to confirm that the URL and query definition are valid.
Computer Details Report
This defines a link to a Computer Investigations report on the analytics server. There are two fields to define the line: Relative URL, which is appended to the Root URL you define, and Query String, which defines the report you want from that URL.
When defined, this Computer Analytics link appears in the External Pages menu on the Computer Details page.
Click the Test button to the right of this line to confirm that the URL and query definition are valid.
User Details Report
This defines a link to a Console User Search (in this case, Carbon Black App Control Console Login Accounts) report on the analytics server. There are two fields to define the line: Relative URL, which is appended to the Root URL you define, and Query String, which defines the report you want from that URL.
When defined, this User Analytics link appears in the External Pages menu on the Edit Login Account page.
Click the Test button to the right of this line to confirm that the URL and query definition are valid.
Set Analytics URLs to Splunk defaults
Clicking this button inserts Splunk default Relative URL and Query String definitions into the three report fields. It also inserts “http://server:8000” in the Root URL field (port 8000 is the Splunk default).
When you replace “server” with a valid Splunk server URL, these defaults should allow access to valid Splunk reports from the Carbon Black App Control Console.
Clear Analytics URLs
Clicking this button clears all values from the Analytics Server and Analytics Server Reports fields.
