Table-only portlets can be a good choice to display Carbon Black App Control data that does not lend itself to graphic representation.
For example, you might not be interested in how many computers or files meet certain criteria, but instead want to present a more complex picture of different kinds of data for each computer, or for each file.
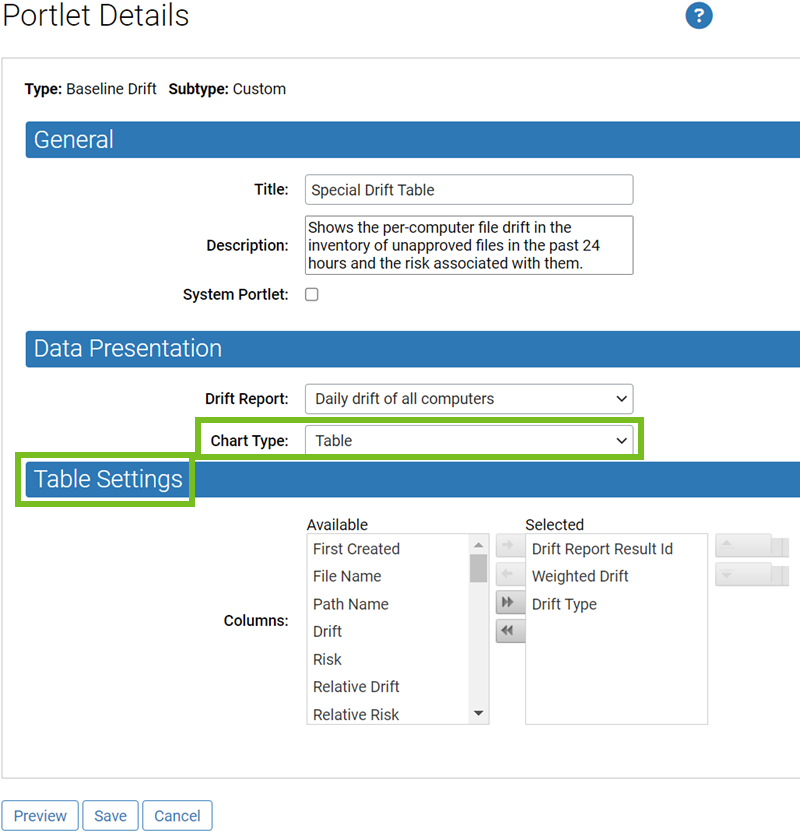
When table-only presentation is an option, a Data Presentation panel displays on the Portlet Details page. In that panel, you can choose Table as the Chart type. Selecting this option replaces the Graph Settings panel on the Portlet Details page with a Table Settings panel in which you choose and order the data to include in the table.

You must select the columns to appear in the table. You can double-click a data element in the Available column to move it to the Selected column and vice versa. You can use the arrow buttons to move items back and forth between Available and Selected, and to change the order of data in the table.
Table portlets provide many features for rearranging the data they display:
- You can have multi-page tables and navigate between pages using the page and arrow buttons in the bottom left of the portlet.
- You can determine the number of rows displayed in a table by choosing a different page size (in multiples of 10 rows).
- You can click over a column and drag it to a different location in the table.
- You can click over a column heading and drag it into the labeled zone at the top of the portlet to group the table by the data named in the column heading.
- You can filter the contents of a table by any column head to show data of interest. (You also can pre-filter the data using the Filters on the Portlet Details page.)
- You can click a column head to sort by the data in that column.
To filter on a column, enter a string in the box below the column, and then click the Filter button to see the operator menu.