


The Unified Management tab on the System Configuration page displays information about the management server and its client servers.
The panel for the management server and each successfully connected client server includes the following information:
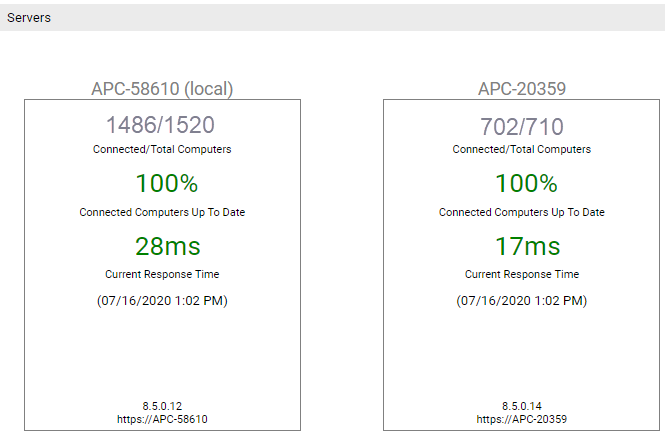
- Server Name
- Connected/Total Computers – The number of agent computers currently connected to the server and the total number of connected and disconnected agents registered with this server
- Connected Computers Up To Date – The percentage of currently connected computers whose Policy Status is Up to Date. If there are no connected computers, the value shown is N/A.
- Current Response Time – The current latency (in milliseconds or seconds) of the communications between the management server and its client servers, measured at the time of the Unified Management page is loaded. In addition to numeric values, color coding provides a quick status of the connection quality:
- 500 Milliseconds or Less: Shown in green. It indicates that the remote server is responding well, with latency similar to a local server.
- 501 Milliseconds to 1 Second: Shown in yellow. It indicates that the remote server is responding slowly.
- Greater than 1 Second: Shown in red. It indicates that the remote server is responding very slowly.
- N/A: Shown in red. It indicates that the server has not responded during a 10-15 second waiting period.
- Timestamp – Shown in parentheses below the Current Response Time. It shows the time of the most recent latency check.
- Server Version – The Carbon Black App Control Server version number for this server
- Server URL – The URL for the server. For client servers, this URL is the URL that you provided when you added the server to Unified Management.
