You can access a visualization or process tree of your alerts.
On the Alerts page, click the Alert Triage  icon next to the item of interest. The Alert Triage page opens.
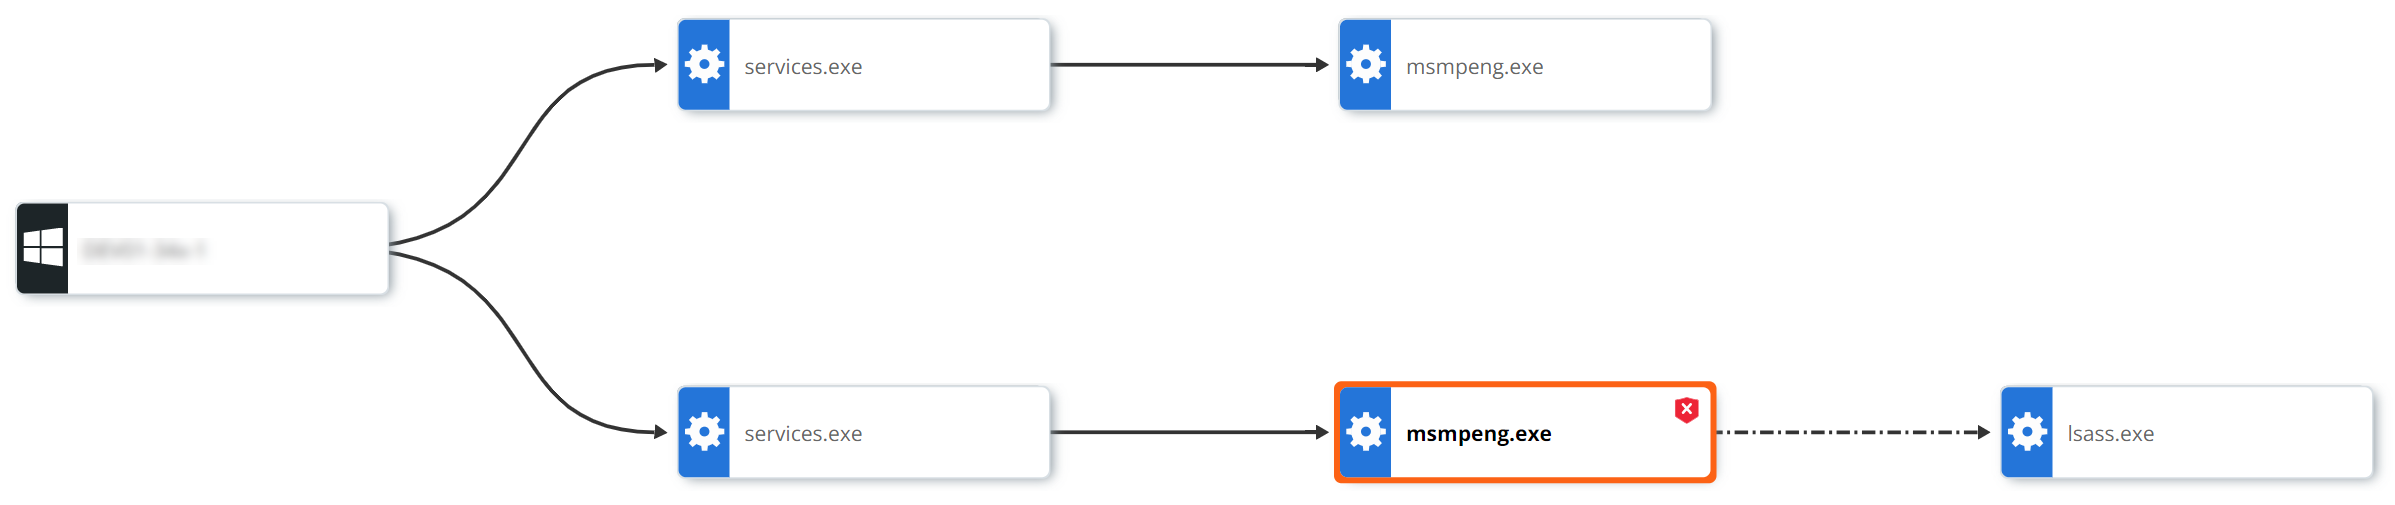
Each event in the attack stream (process, file, or network connection) is shown in the process tree as a node. The attack origin displays on the left and each subsequent event is shown from left to right as the attack progressed.
Node Types
-
Operating System/Root Node: The root node at the far left of the process tree represents the host device on which the original activity took place. The root node icon represents the operating system that was running on the device.
-
Gears/Processes: Processes that have run or are still running.
-
Documents/Files: Files that were created on disk.
-
Network Connections/IP addresses: IP addresses are shown as network connection icons.
Line Types
-
Invoked: A solid line indicates that one process invoked another process, file, or network connection.
-
Injected: A dashed line indicates that one process injected code into another process.
-
Read Memory: A dotted and dashed line indicates that one process attempted to read the virtual memory of another process (but did not inject into the process).
-
Accessed Target: A dotted line indicates that one process attempted to enter another process (but did not inject into the process).
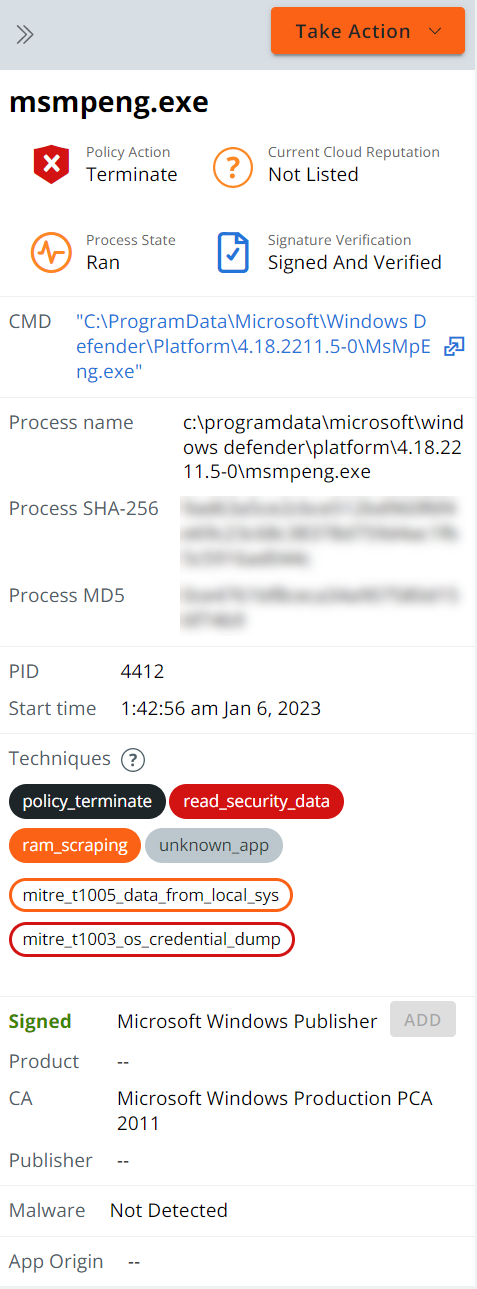
Selected Node Panel
Click a node to view additional information and take action in the Selected Node collapsible panel.