This topic describes the Group by and View by features on the Observations page.
In addition to grouping events by time period, you can group by the following fields:
- Type
- Device
- Username
- Local IP
- Remote IP
- ATT&CK Tactic
- Process Hash
Grouped results are subject to a 10,000 result limit.
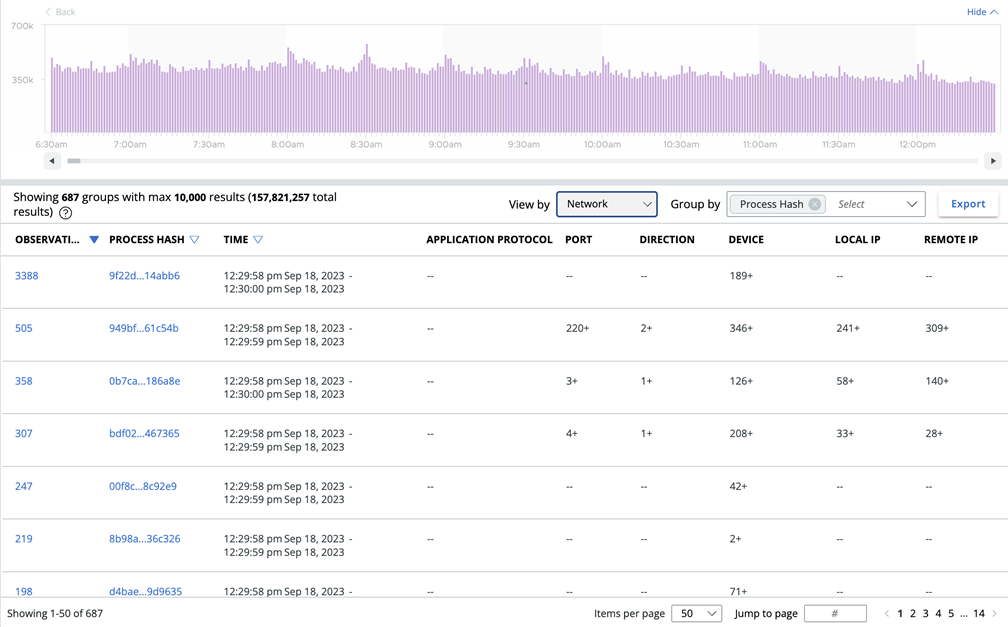
Your View by options are to view by Default, Process, Devices, or Network. You can configure each view to determine which columns display in each view by clicking the Configure Table button at the bottom of the page.
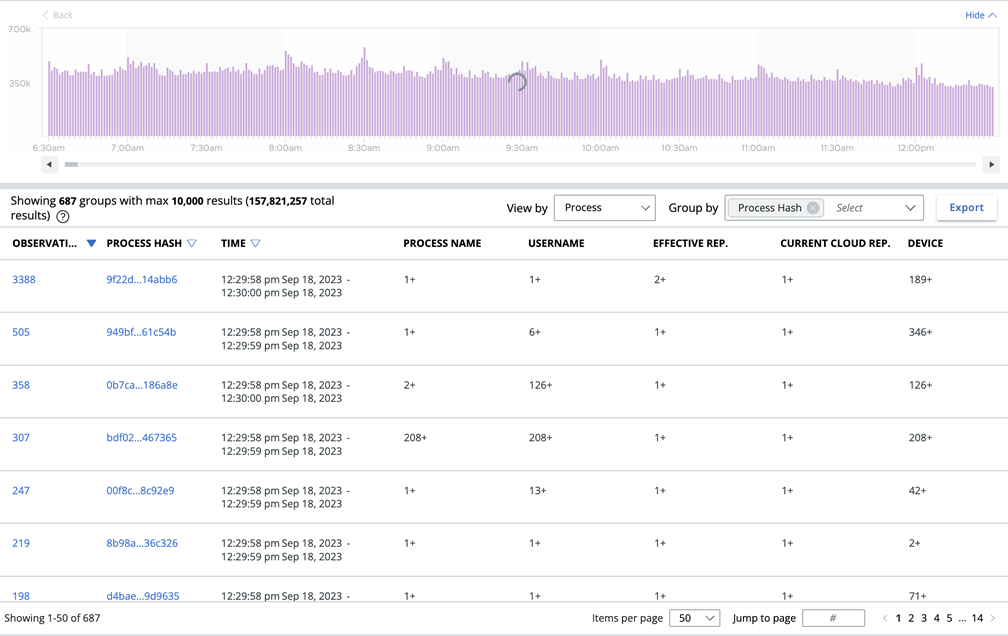
The View by and Group by features allow you to make interesting combinations of results. For example, View by lets you quickly change what column set you apply to the data. Selecting View by Network provides the IP address, port, and protocol columns. You can then Group by Remote IP to see how many Observations occurred for each Remote IP. You can also View by Process + Group by Process Hash to see all the applications running in your environment.
You can then add Group by Remote IP to see how many Remote IPs are touched by each piece of software or malware variant.
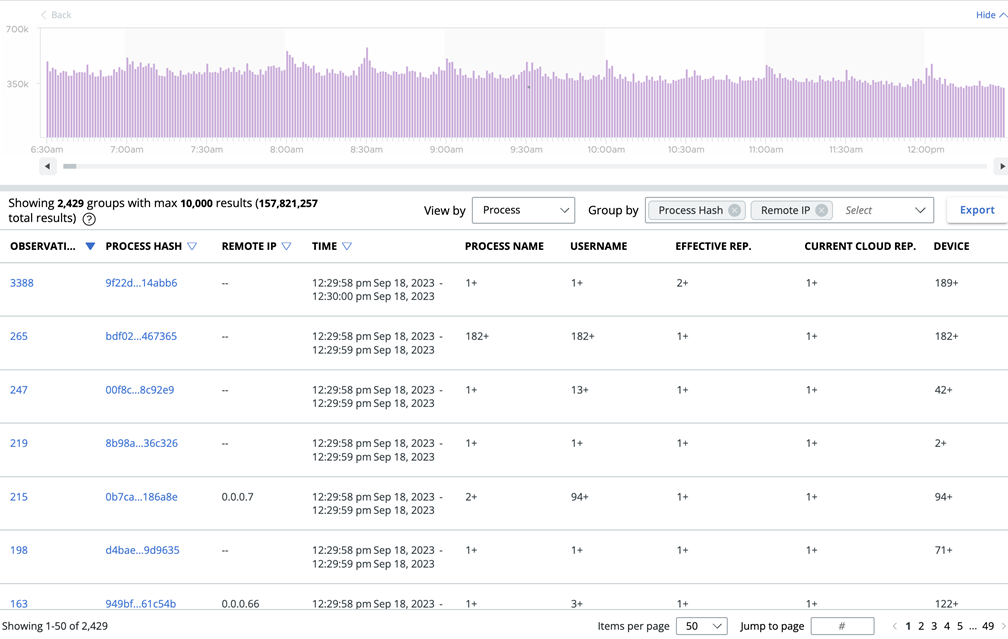
Multiple groupings lets you see the spread of an activity across multiple dimensions. Grouping first by Process and then by IP lets you view which processes contact which IP addresses most frequently. This view can help you determine who is contacting specific IP addresses.
You can view grouped data in different ways. For example, View by Network and then Group by Process Hash to see which processes touch the most IP addresses. This combination helps you see which processes create the most noise.