


This section describes the Process Analysis page in the Carbon Black Cloud console.
At the top right of the Process Analysis page, click the orange Take Action button to quickly add a hash to the banned list, enable or disable bypass mode on device, quarantine or unquarantine a device, or view detections in VirusTotal.
The top section of the Process Analysis page contains the following information:
- The primary process that is being analyzed
- The currently selected process (node)
- Date and time
- Process path
- Device details, including:
- Last logged-in user
- OS version
- Device name
- IP address
- Location
- Applied policy
You can click the More button to view additional details about this device:
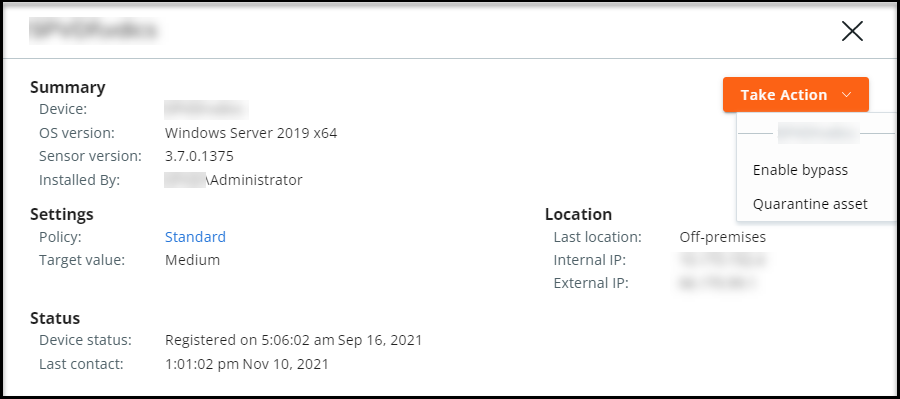
Additional details are included in this view:
- Sensor version
- Installed by
- Target value
- Device registration date
- Device last contact date
- Last location
You can click the Take Action button in this window to enable bypass or quarantine the device.
Visualizing Processes
A visualization of your processes, or a process tree, displays in the main section of the Process Analysis page.
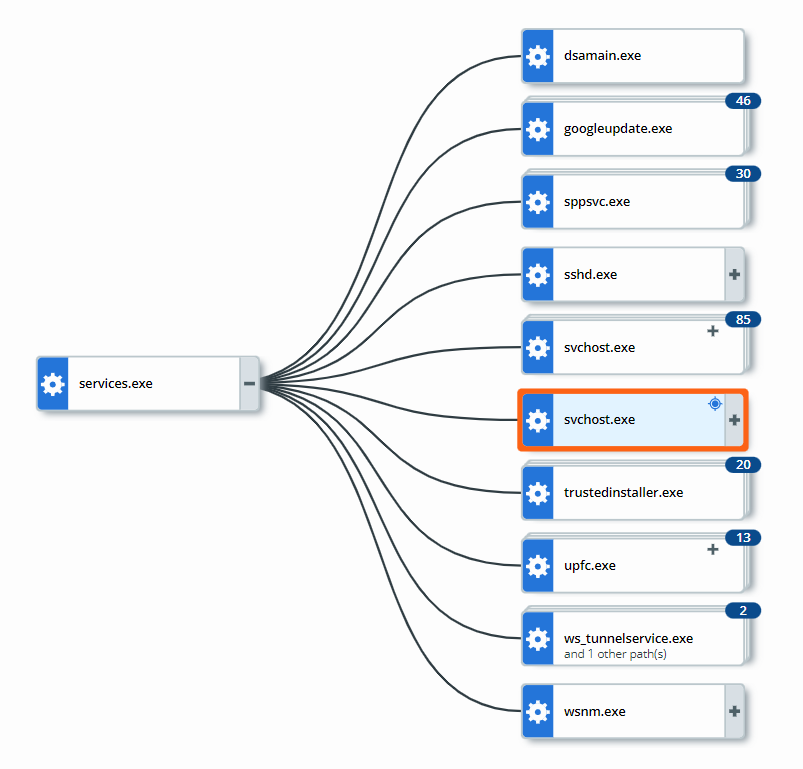
Each process in the attack stream is shown in the process tree as a node with the attack origin displayed on the left and each subsequent event shown from left to right as the attack progressed. Process trees that have an excessive number of parent or child processes might not display all nodes.
You can group processes by hash by clicking the Group by hash toggle. This action causes the process tree to group all processes that have an identical hash, regardless of whether there are child processes or watchlists. The target node is not grouped. Grouping by hash can reduce the number of nodes shown on the page and improve readability.
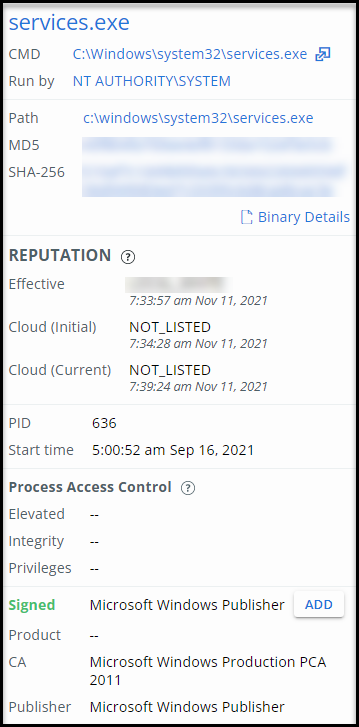
Selected Node
Click a node to view additional information and take action in the Selected Node collapsible panel.
Binary Details
Select the Binary Details button in the Selected Node panel to view additional details about a binary.
Reputation
Reputation is a given level of trust or distrust.
- Effective Reputation is the reputation applied by the sensor at the time the event or observation occurred, based on Carbon Black analytics, cloud intel, and other data.
- Cloud Reputation (Initial) is the hash reputation reported by Carbon Black Cloud intel sources at the time that the event or observation was processed by the backend.
- Cloud Reputation (Current) is a real-time check of the hash reputation that is reported by Carbon Black Cloud intel sources.
Signature Definitions
- Effective Signature
- The Effective Signature is the signature at the time the process event occurred. This primary signature corresponds with the process publisher state, the state of the digital signature, or signatures of a Windows or macOS process binary.
- Most Prevalent Signature
- Carbon Black reviews all prior signatures associated with a particular Windows hash to determine which signature is the most prevalent. This is sourced from the binary details, and can provide additional context when an Effective Signature is not available. Because different endpoints and process instances can render differing signature metadata, the signature seen the most for that process is the one shown. This signature has been observed for this file across your fleet of endpoints for the past 90 days (for customers who have Carbon Black Cloud Enterprise EDR with Windows endpoints).
- First Seen Signature
- What was observed the first time the file was noticed by Carbon Black Cloud on the first endpoint that reported it (for customers who have Carbon Black Cloud Endpoint Standard). The first signature associated with this particular hash within your organization. This field is only available on data from Carbon Black Analytics, and can provide more context when an Effective Signature is not available. However, the latest event in the process can have a signature that differs from the first seen signature.
For more information about signatures, see About Digital Signatures.
Process Access Control
- Elevated: If “True,” the process is running in an elevated (administrator) context. When a process is elevated, policies that set UAC (user access controls) do not apply.
- Integrity: High (administrator), medium (basic user), or low (restricted). Trust is enforced by preventing a process from interacting with processes that have a higher integrity level.
- Privileges: Access tokens that encapsulate security identity (privileges) are assigned to each process. Privileges help enforce security boundaries when a process tries to execute.
Watchlist Hits
A process that displays an orange ! indicates that the process has associated watchlist hits. In this case, the Selected Node pane also displays:
- Severity score of the latest hit
- Name of the report in which the hit was found
- The query on which the hit occurred
- Time of the occurrence of the event, which was captured as a Watchlist hit
Select the query link to pivot to the Investigate page with the query pre-populated in the Search bar.
Process Event Filtering, Search, and Export
In the bottom section of the Process Analysis page, you can use the filters and the search bar to find process events of interest.
Click Search Guide to open the Process Analysis section of the in-product Search Guide, where the supported search syntax and process fields are documented.
Click the Export button to export up to 10,000 process events at a time in CSV format.
